Anyone who wants to buy Bitcoin (BTC) in this period, given the recent explosion in price (+83% in 2 months, almost close to the all time high of $20,000), has basically two questions:
- Is it too late to buy Bitcoin?
- Is the current price too high?
Nobody knows the answers to these questions but, thanks to Bitcoin’s transparency, it is possible to use tools capable of estimating the degree of convenience of the Bitcoin price at a given time.
The Bitcoin Rainbow Chart
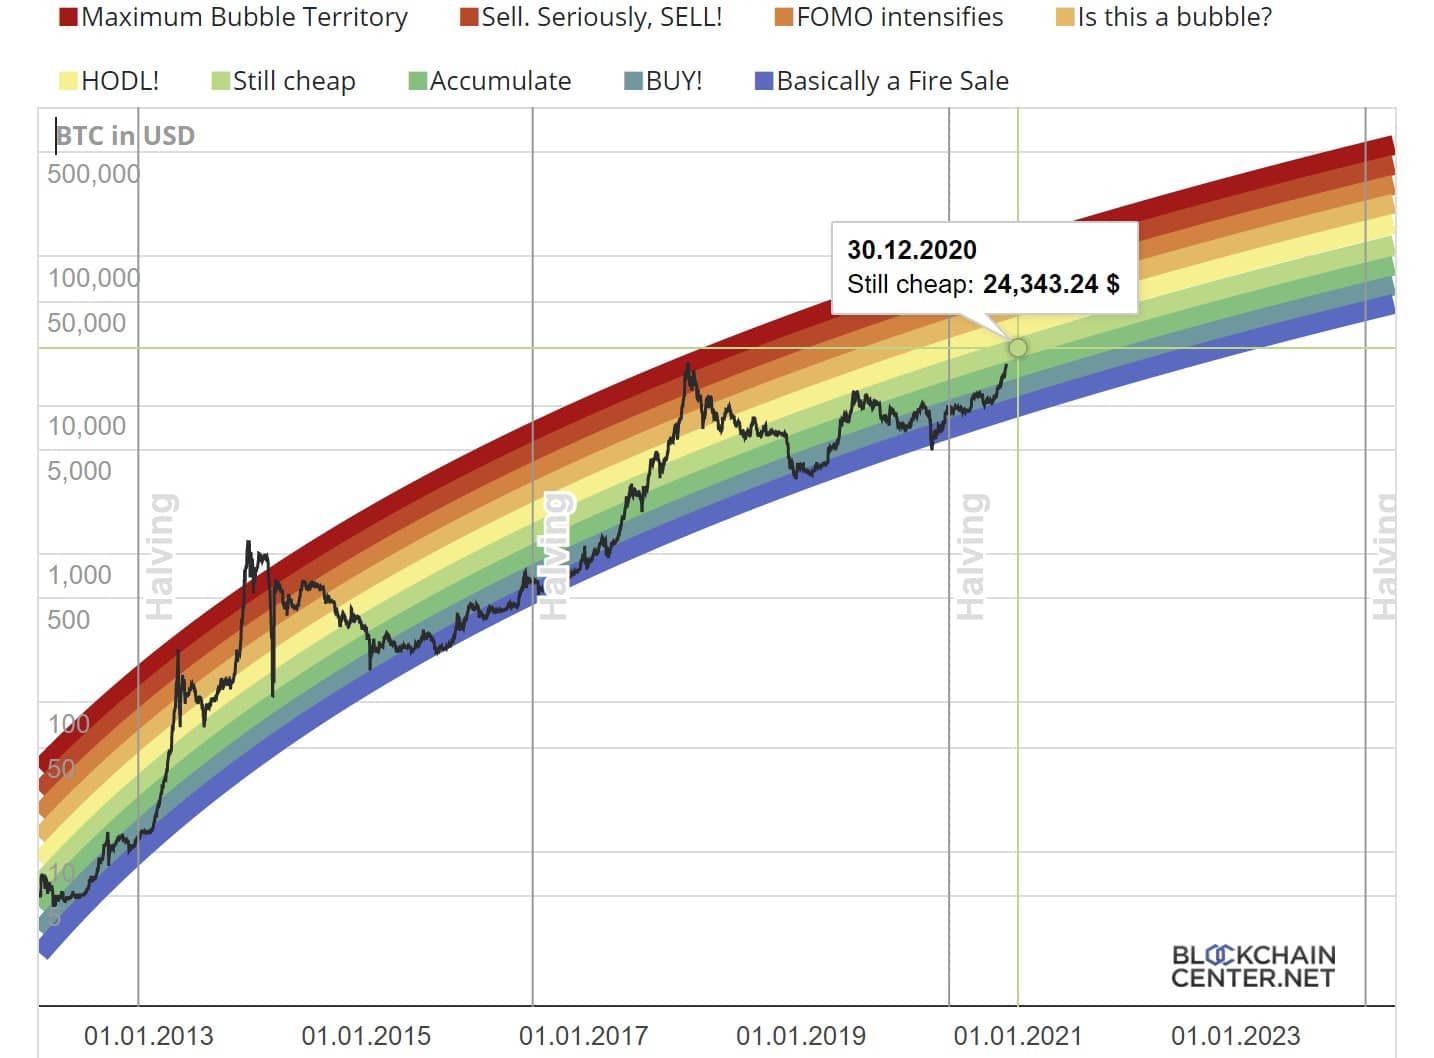
To assist us there is the Bitcoin Rainbow Chart, which estimates the supposed convenience of the price on a specific date.
This chart was created in 2014 by a Reddit user called “azop” and was then improved by the user “trolololo” on BitcoinTalk. Finally, it was published and kept up to date by Über Holger, CEO of Holger and responsible for the content of the Blockchain Center website, where the chart is located.

Source: https://www.blockchaincenter.net/bitcoin-rainbow-chart/
From this chart, we can infer some important indications, such as:
- This indicator is reliable, only if the time horizon is long term (from 4 years and upwards);
- If instead, we intend to trade with Bitcoin, even in the medium term, it makes no sense to use this Bitcoin Rainbow chart.
Dreaming the $20,000: Bitcoin price suggestions
The current price of bitcoin ($18,500) is still in the range called “Accumulate” and by the end of the year a price of $24,343 would be considered “Still Cheap“.
The chart is logarithmic, which means that each level is equivalent to a growth of 10 times. Moreover, it uses a non-linear logarithmic regression function to approximate the Bitcoin price growth curve, as it is more reliable.
As already stated by Über Holger, it does not represent investment advice, as the past trend is not indicative of the future evolution of the price of BTC.


