How are the prices of Ripple (XRP), Litecoin (LTC) and Dogecoin (DOGE) performing in today’s crypto market?
Below is an in-depth analysis regarding the aforementioned coins.
Summary
Price analysis of Ripple (XRP), Litecoin (LTC) and Dogecoin (DOGE)
As a reminder, Ripple (XRP), is a real-time funds transfer system, a network for currency exchanges and remittance sending, created in 2012 by Ripple Labs, at the time OpenCoin.
Litecoin (LTC), on the other hand, is a peer-to-peer crypto and an open source software project released under an MIT/X11 license.
Finally, Dogecoin is the crypto whose logo is graphically based on an Internet meme representing a Shiba dog.
Focus on Ripple: comparison with Litecoin and Dogecoin prices
As we know, the price of the crypto Ripple (XRP) was rejected by a key resistance level a few weeks ago, highlighting indecision with respect to the coin.
However, even in this condition, there still seems to be hope for bullish people that the rally is not over.
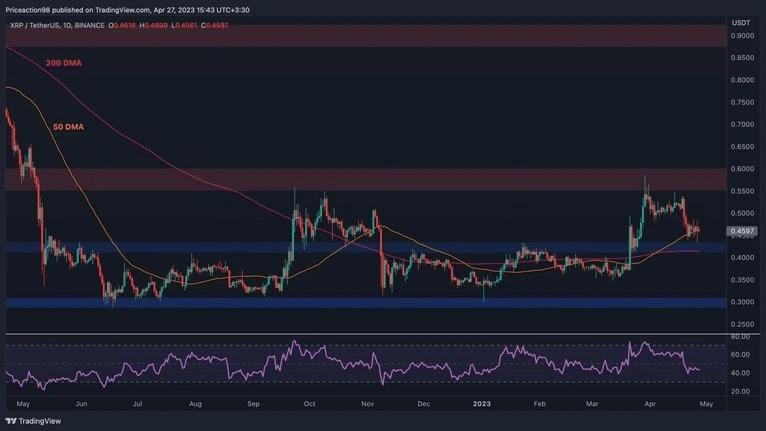
In any case, the price of XRP failed to break through the $0.55 resistance level and has been declining ever since. In addition, the 50-day moving average is currently providing support near the $0.46 mark and is closely followed by the 200-day moving average at around $0.41.
Hence, this confluence of support elements makes the $0.40 level significantly important, and a break below would likely lead to a rapid decline toward the $0.3 mark in the coming weeks.
On the other hand, a rebound from this area would pave the way for another test of the $0.5 resistance zone, with a greater likelihood of a bullish breakout.
In all this, we see the SEC case against Ripple is moving forward these days. Specifically, the US District Court for the Central District of California held a hearing Wednesday on the class action case against Ripple Labs, known as Zakinov vs Ripple.
During the hearing, oral arguments reportedly focused on the certification of the class of XRP holders suing Ripple.
In addition, in a recent tweet, Deaton complained that the hearing judge would not allow amicus (“friend of the court”) testimony during oral arguments, while acknowledging that it is an established court policy, not a decision specific to the hearing.
Litecoin (LTC) price in a clear downward trend
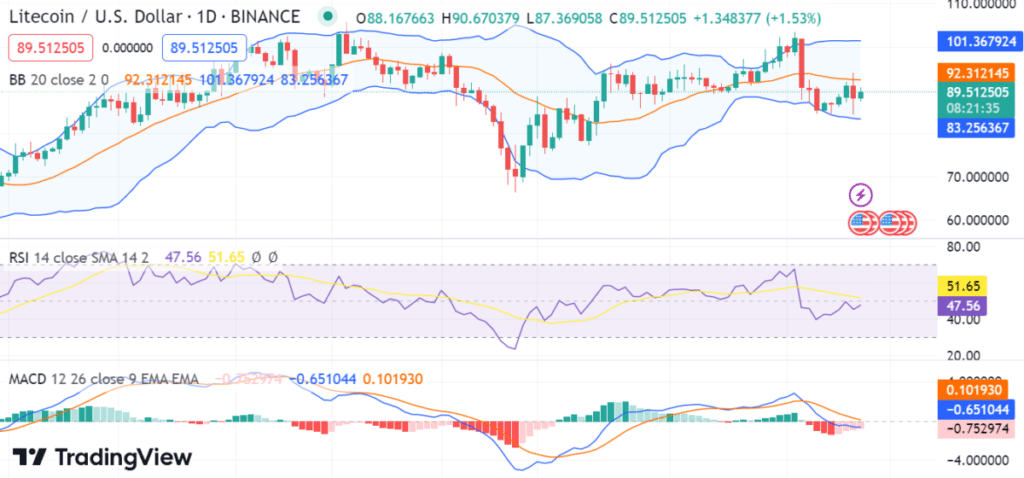
If we look at the chart with technical analysis on the 1-day LTC price, we can see a clear downward trend.
Specifically, prices have been falling steadily over the past few days and there seems to be no end to the current downward trend at $88.87.
In addition, the price has decreased by 3.25% in the last 24 hours and is currently trading in a sideways trend. However, experts argue that the market will start to rise once it passes this range.
Hence, investors should look for a breakout above the $92.57 resistance or a break below the $85.43 support to enter new positions. In any case, the MACD indicator also shows bearish momentum, indicating further downside potential in the short term.
However, if we look at the RSI, it is currently around 47.56, showing that the market is neither overbought nor oversold.
Finally, the Bollinger band is also narrowing, a factor that suggests a potential future market breakout, with the upper and lower bands close together, indicating that the market is in a consolidation phase.
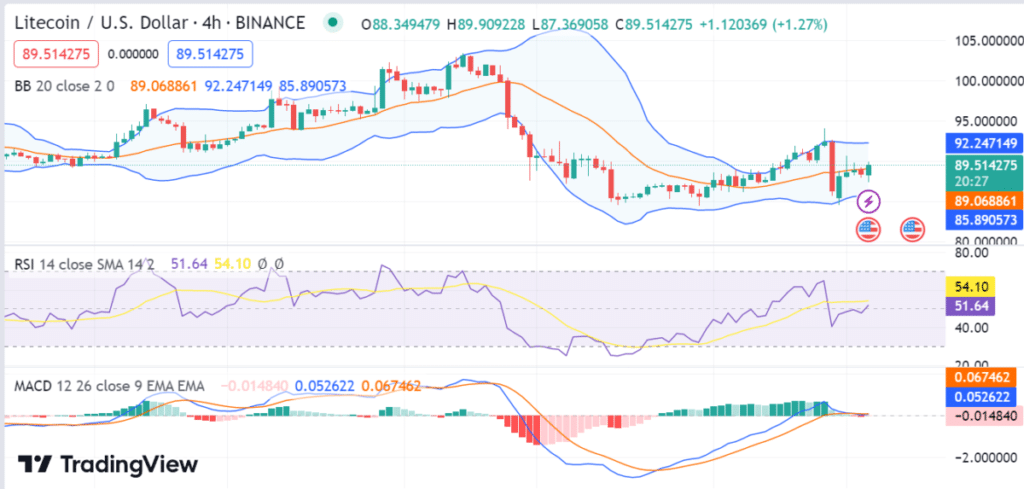
In any case, it is important to note that the hourly price chart of Litecoin shows a slightly different picture than the above.
In fact, we see that the bears have been in control of the market since yesterday, but there also seems to be some buying pressure pushing prices up.
Hence, if more buyers enter the market, this could signal the end of the bearish trend and open up opportunities for traders to go long on Litecoin.
Bitcoin could pave the way for the price of Dogecoin
In the past few hours, the price of DOGE broke through the recent high below $0.081 to reach $0.0835, before immediately plummeting to $0.0748.
As a result, both bulls and bears have been affected by these developments, and DOGE’s rebound to $0.08 resistance once again meant that traders may pay attention.
In particular, the bullish argument was based on the steady rise in OBV over the past three days, which showed that buying volume has outpaced sellers. Hence, another upward move was likely after the recent flow.
However, the downside of this argument was the momentum and market structure of DOGE. In fact, the drop below $0.0775 meant that the structure was bearish, and the RSI was at 48 to show that a bullish trend was not yet in place.
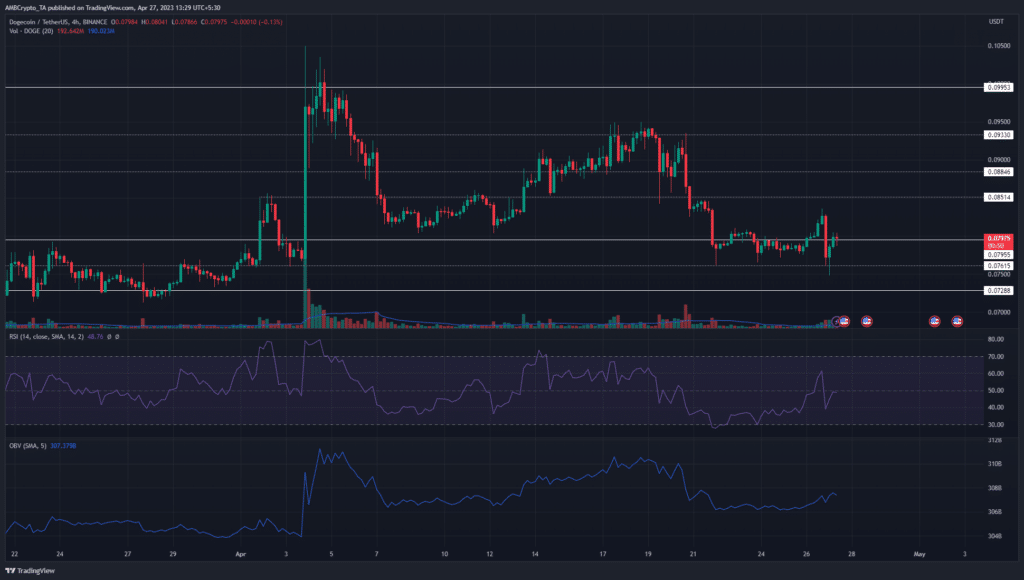
In any case, Bitcoin (BTC) could pave the way for the altcoin market. In fact, aggressive bulls may try to ride a breakout of Dogecoin above $0.081, provided BTC ventures back above $29k.


