Summary
Bitcoin Analysis
Bitcoin’s price alternated between red and green candles over the weekend and finished Sunday’s daily session in positive figures and +$558.
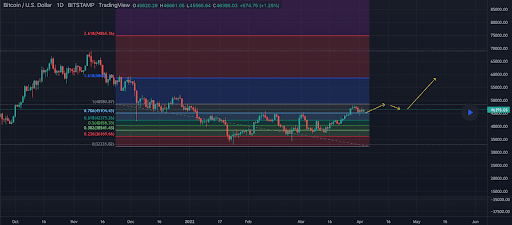
The BTC/USD 1D chart below from mukri81 shows BTC’s price trading between the 0.786 fibonacci level [$45,104.43] and 1 [$48,580.87], at the time of writing.
Those that are optimistic about BTC’s price in the interim are aiming to break the 1 fib level followed by a second target of 1.618 [$58,620.31]. The third target for bullish traders is 2.618 [$74,865.36].
The targets to the downside on BTC for bearish traders are 0.786, 0.618 [$42,375.26] and 0.5 [$40,458.35].

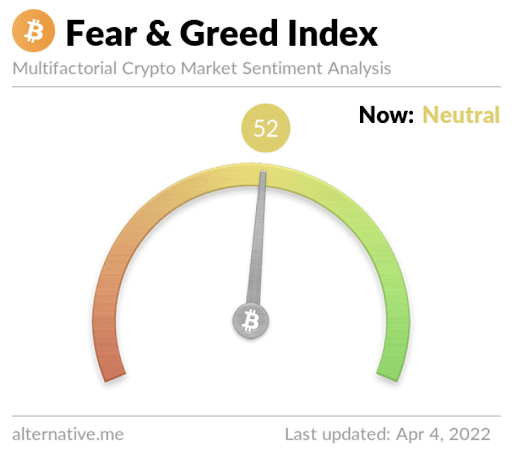
The Fear and Greed Index is 52 Neutral and is +4 from Sunday’s reading of 48 Neutral.

BTC’s 24 hour price range is $45,667-$47,322 and its 7 day price range is $44,347-$47,884. Bitcoin’s 52 week price range is $29,341-$69,044.
The price of bitcoin on this date last year was $57,060.
The average price of BTC for the last 30 days is $42,220.2.
Bitcoin’s price [+1.22%] closed its daily candle worth $46,383 on Sunday.
Ethereum Analysis
Ether’s price finished up over 2% on Sunday and concluded its daily session +$78.84.
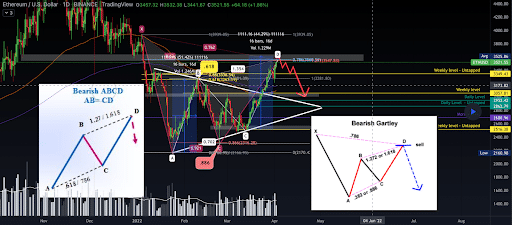
The second chart we’re analyzing today is the ETH/USD 1D chart below by Chahin073. The chartist posits that Ether’s price is currently in the midst of painting a Bearish Gartley pattern on the daily timescale.
We can see that Ether’s price is potentially nearing the peak of the D wave at the 0.786 fib level [$3,560.56] if the Bearish Gartley proceeds to formulate.
The primary target to the upside for bullish Ether market participants is 1 [$3,939.05]. Conversely, the primary target to the downside to help kickoff the Bearish Gartley pattern is 1 [$3,281.80].

Ether’s Moving Averages: 5-Day [$3,394.03], 20-Day [$2,935.46], 50-Day [$2,846.52], 100-Day [$3,365.42], 200-Day [$3,278.52], Year to Date [$2,946.10].
ETH’s 24 hour price range is $3,421-$3,573 and its 7 day price range is $3,220-$3,573. Ether’s 52 week price range is $1,719-$4,878.
The price of ETH on this date in 2021 was $2,016.67.
The average price of ETH for the last 30 days is $2,925.34.
Ether’s price [2.29%] closed its daily candle on Sunday worth $3,521.13.
Zilliqa Analysis
Zilliqa’s price pulled-back greater than 17% over the weekend and when traders settled up on Sunday ZIL’s price was -$0.012 for the day.
The third chart we’re looking at for Monday is the ZIL/USD 1W chart below from ALTCOIN_BEAST. Zilliqa’s price is trading between the 0.786 fib level [$0.138] and 1 [$0.180] on the weekly time frame, at the time of writing.
Traders looking for more upside on the weekly time frame are taking aim at the 1 fib level, 1.272 [$0.22], and 1.618 [$0.28].
From the perspective of bearish traders, their targets are 0.76 followed by 0.5 [$0.09], and thirdly 0.382 [$0.07].

ZIL’s Moving Averages: 5-Day [$0.159], 20-Day [$0.075], 50-Day [$0.057], 100-Day [$0.064], 200-Day [$0.079], Year to Date [$0.058].
Zilliqa’s 24 hour price range is $0.149-$0.172 and its 7 day price range is $0.098-$0.218. ZIL’s 52 week price range is $0.033-$0.255.
Zilliqa’s price on this date last year was $0.182.
The average price of ZIL over the last 30 days is $0.069.
Zilliqa’s price [-7.31%] closed its daily session valued at $0.153 on Sunday.


