Summary
Bitcoin Analysis
Bitcoin’s price lost value for an eighth consecutive day on Tuesday and concluded its daily session -$315.
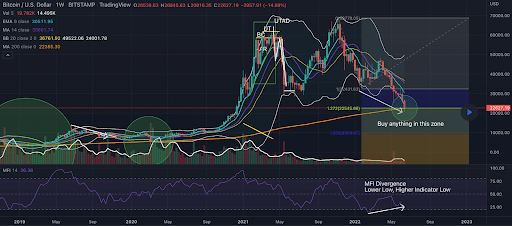
The first chart we’re looking at today is the BTC/USD 1W chart below from LDAKyle. BTC’s price is trading between 1.618 [$9,969.87] and 1.272 [$22,545.66], at the time of writing.
The chartist denoted on the chart that BTC bulls should buy anything below the 1.272, that it’s the ‘Buy anything in this zone’ region of the chart.
We can also see that BTC’s price is trading below the 200W MA [$22,365.30]. Bullish BTC traders need to regain that moving average to start a potential reversal to the upside before bears can inflict further damage to the downside of the charts.

The Fear and Greed Index is 7 Extreme Fear and is -1 from Tuesday’s reading of 8 Extreme Fear.

BTC’s 24 hour price range is $20,859-$23,377 and its 7 day price range is $20,859-$31,166. Bitcoin’s 52 week price range is $20,859-$69,044.
The price of Bitcoin on this date last year was $40,139.
The average price of BTC for the last 30 days is $29,365.1 and its -23.1% over the same timespan.
Bitcoin’s price [-%] closed its daily candle worth $22,172 on Tuesday.
Ethereum Analysis
Ether’s bulls bucked the macro trend on Tuesday to give ETH’s price a lift and a short reprieve from the incessant selling of the last 2 ½ months. When Tuesday’s daily session had wrapped-up ETH’s price was +$4.6.
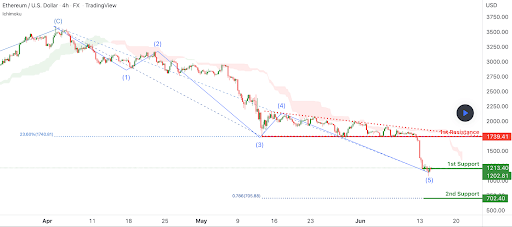
The second chart we’re providing analysis for today is the ETH/USD 4HR chart below by desmondlzw. ETH’s price is trading between the 0.786 fibonacci level [$705.88] and 23.60% [$1,740.81].
Bearish traders have been entirely in control of Ether’s price action for over 2 ½ months now and bulls are still seeking refuge as another red weekly candle looks imminent only two days into a new week.
For bullish traders to reverse course they need to regain the 23.60% fib level and again flip that level back to support with candle close confirmation on multiple timescales.
Conversely, bearish traders are looking to push ETH’s price below 0.786 which would spell an even longer bear market for Ether market participants.

ETH’s 24 hour price range is $1,075.8-$1,268.45 and its 7 day price range is $1,075.8-$1,826.33. Ether’s 52 week price range is $1,075.8-$4,878.
The price of ETH on this date in 2021 was $2,543.82.
The average price of ETH for the last 30 days is $1,829.44 and its -38.38% over the same duration.
Ether’s price [+0.38%] closed its daily candle on Tuesday worth $1,210.94 and ETH broke a seven day streak of red candles on the daily time frame.
Binance Coin Analysis
Binance Coin’s price finished marginally in green figures on Tuesday as well and concluded its daily session +$0.40.
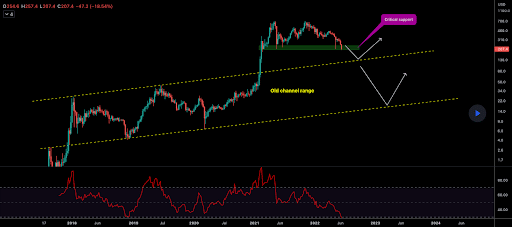
The third chart we’re analyzing today is the BNB/USD 1W chart below from Babenski.
We can see that bullish traders are trying to cling to BNB’s current range between $197.1-$240. Without an impulse from bullish traders or a reversal of the macro cryptocurrency market’s momentum, BNB’s price could soon be testing the top of its old range at $130.9.

Binance Coin’s Moving Averages: 5-Day [$263.15], 20-Day [$296.80], 50-Day [$346.53], 100-Day [$387.09], 200-Day [$443.32], Year to Date [$387.09].
Binance Coin’s 24 hour price range is $204.1-$231.4 and its 7 day price range is $204.1-$296.94. Binance Coin’s 52 week price range is $204.1-$668.8.
BNB’s price on this date last year was $366.78.
The average price of BNB over the last 30 days is $296.89 and its -23.51% over the same time frame.
Binance Coin’s price [+0.18%] closed its daily session on Tuesday worth $223.1 and bullish BNB traders snapped a four day streak of red daily candles.


