Despite closing in red figures on Wednesday, bullish BTC market participants confirmed a backtest of Bitcoin’s breakout on the daily time frame. Bitcoin market participants therefore confirmed that the major level of inflection that we’ve been focusing on for weeks from 2017 [$19,891] is no longer technically resistance but a support for bullish market participants. When Wednesday’s session wrapped-up, BTC’s price was -$182.9.
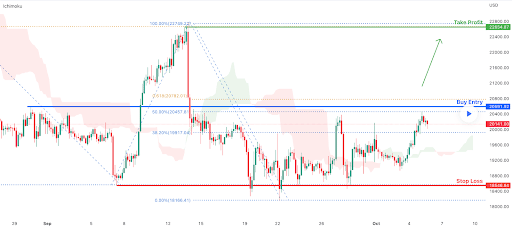
We’re beginning our price analyses for this Thursday with the BTC/USD 4HR chart from FXCM. BTC’s price is trading between the 38.20% fibonacci level [$19,917.04] and the 50.00% fib level [$20,457.81], at the time of writing.
Bullish BTC market participants have held their ground after again rallying at the 0.00% fib level. Their targets above are the 50.00% fib level followed by 0.618 [$20,782.01], and 100.00% [$22,749.22].
At variance with those wanting to see the market correct again to the upside are bearish traders – they’ve targets below of 38.20%, and a retest of 0.00% [$18,166.41] on the 4HR time frame.
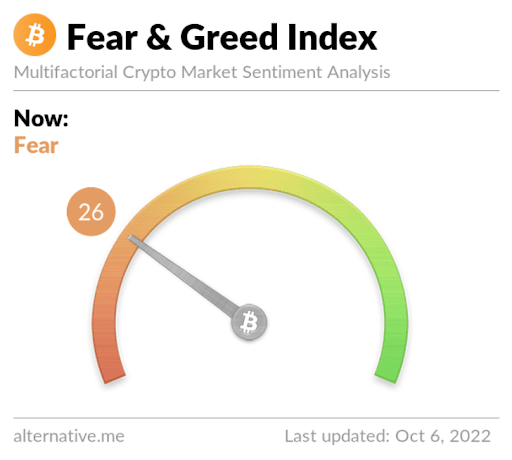
The Fear and Greed Index is 26 Fear and is +1 from Wednesday’s reading of 25 Extreme Fear.
Bitcoin’s Moving Averages: 5-Day [$19,753.18], 20-Day [$19,745.82], 50-Day [$21,172.23], 100-Day [$22,653.35], 200-Day [$31,507.32], Year to Date [$31,352.72].
BTC’s 24 hour price range is $19,750-$20,363 and its 7 day price range is $19,065.15-$20,363. Bitcoin’s 52 week price range is $17,611-$69,044.
The price of bitcoin on this date last year was $55,331.
The average price of BTC for the last 30 days is $19,760.9 and its +0.5% for the same stretch.
Bitcoin’s price [-0.90%] closed its daily candle worth $20,157.1 on Wednesday and back in red figures for the first time in three days.
Summary
Ethereum Analysis
Ether’s price also dropped less than 1% during its trading session on Wednesday and finished up its day -$9.45.
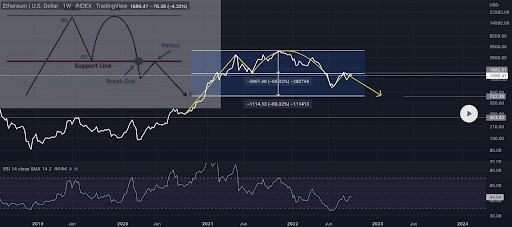
We shift our focus secondly today to the ETH/USD 1W chart by wistfulautomata. Traders can look back at the first chart from our price analysis of it on September 29th here.
The chartist posited last week that we could be seeing ETH’s price forming an inverted Adam and Eve pattern. If bearish traders are able to continue their rejection of bullish ETH traders in their bid to regain the $1,900 level then this pattern will be brought to completion.
The first major target to the downside for bearish traders to confirm the pattern is the $722.26 level. As noted last week, if bullish traders fail to hold that level their next support on the chart is the $303 level.
Ether’s Moving Averages: 5-Day [$1,335.93], 20-Day [$1,428.19], 50-Day [$1,588.85], 100-Day [$1,519.62], 200-Day [$2,214.87], Year to Date [$2,199.75].
ETH’s 24 hour price range is $1,316.29-$1,364.77 and its 7 day price range is $1,279.42-$1,364.77. Ether’s 52 week price range is $883.62-$4,878.
The price of ETH on this date in 2021 was $3,575.58.
The average price of ETH for the last 30 days is $1,450.34 and its -13.89% over the same period.
Ether’s price [-0.69%] closed its daily candle on Wednesday valued at $1,352.05 and also in red digits for the first time over three days.
Cronos Analysis
Crono’s price was the worst performer of the lot we’re covering today but only marginally. CRO’s price finished down over 1% and was -$0.0012 for Wednesday’s trading session.
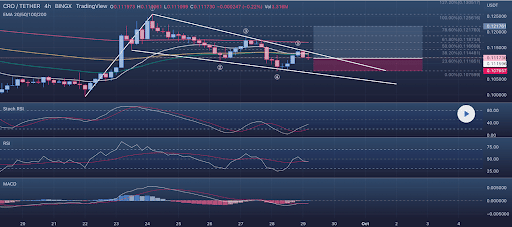
The final chart we’re covering today is the CRO/USDT 4HR chart below from priitzzy. CRO’s price is trading between the 0.00% fibonacci level [$0.107599] and 23.60% [$0.111851], at the time of writing.
The primary target of bullish traders is the 23.60% fib level followed by targets on the 4HR timescale of 38.20% [$0.114481], 50.00% [$0.116608], 61.80% [$0.118734], 78.60% [$0.121760], 100.00% [$0.125616], and 127.20% [$0.130517].
Conversely, bearish traders that are shorting the CRONOS market have a primary target of a full retracement at the 0.00% fib level with an aim of sending CRO back under a dime.
CRO’s Moving Averages: 5-Day [$0.11], 20-Day [$0.11], 50-Day [$0.125], 100-Day [$0.133], Year to Date [$0.199].
Crono’s 24 hour price range is $0.1084-$0.1117 and its 7 day price range is $0.1084-$0.1128. CRO’s 52 week price range is $0.098-$0.954.
Crono’s price on this date last year was $0.187.
The average price of CRO over the last 30 days is $0.1127 and its -7.78% over the same duration.
Crono’s price [-1.08%] closed its trading session on Wednesday worth $0.1103 and in red figures for the third time over the last four trading sessions.


