How are the cryptocurrencies ApeCoin (APE), Stacks (STX) and Balancer (BAL) performing in the market?
Below is an overview of price trends and the latest news about them.
Summary
Analysis of ApeCoin (APE), Stacks (STX) and Balancer (BAL) scripts
Recall that ApeCoin is a token used in DAO to reward development teams, investors and owners of the Bored Ape and Mutant Ape NFTs.
STX, on the other hand, is the native cryptocurrency of the Stacks network, used to power smart contracts for bitcoin, reward miners, and allow holders to earn bitcoin by staking.Balancer, finally, is a decentralized finance (DeFi) protocol running on top of Ethereum that seeks to incentivize a distributed network of computers to run a decentralized exchange where users can buy and sell any cryptocurrency.
Focus on the price of crypto APE compared to STX and Balancer
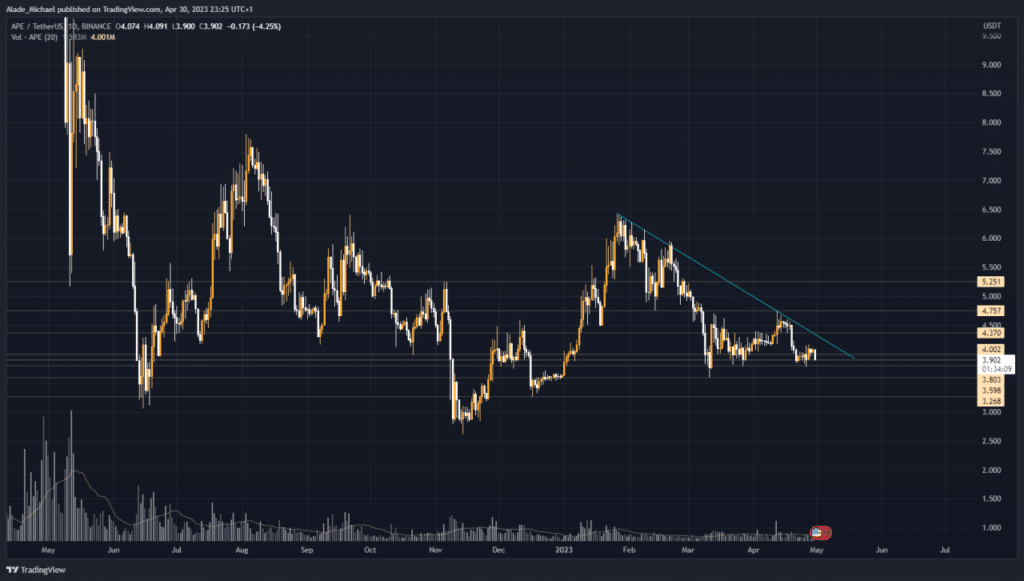
Within the crypto market, ApeCoin (APE) coin, unlike others, seems to be in a stasis without any major price movement, losing as much as 4% in the last few hours.
So, while APE is in a bearish state, albeit with reduced volatility, it seems that the bears took advantage and took a break last week, as the price has remained calm since then.
However, it also seems that sentiment is slowly turning bullish after the market’s recent rally. Meanwhile, the price of APE still faces a descending resistance line on the daily chart.
As a result, it may continue to suppress buying pressure if the resistance line continues to form. Conversely, a clear break above this line should trigger a huge bullish rally.
Finally, we see that ApeCoin appears to have entered an oversold zone on the daily chart.
So, if the price falls below the established support at $3.8, the key selling areas to watch are the support levels at $3.63 and $3.26.
On the other hand, a bounce from the current level could allow for a positive move towards $4.37 before a break at $4.75. Should the price fail to recover from this point, the next resistance level to watch would be $5.25.

Stacks (STX) Up 17 Percent as Bitcoin Reaches Record Levels
Over the past few hours, activity on the Bitcoin network has reached record levels, enough to trigger a spike in the price of STX.
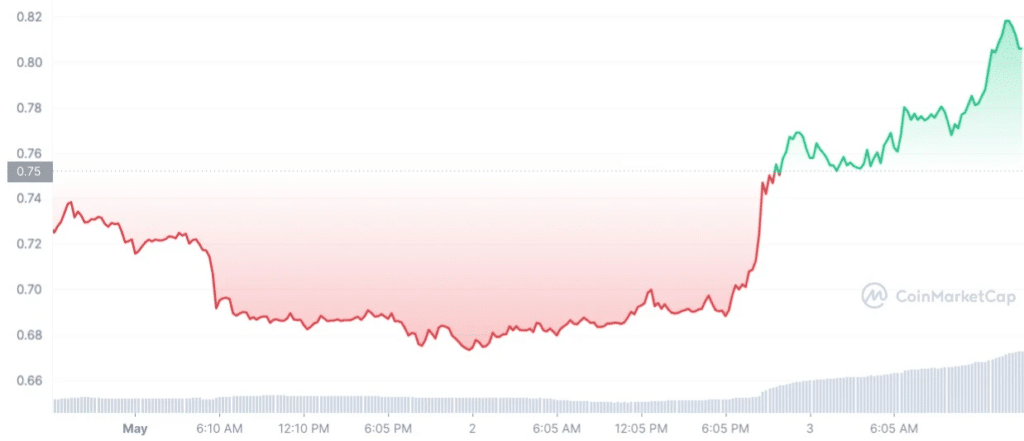
In fact, since the beginning of the week, the token has gained nearly 20 percent in value, making it the top performer among the 100 largest cryptocurrencies by market cap.
Obviously, the reason for such price action at a time of total market turmoil is record activity on the Bitcoin network.
According to the data, there has been a significant increase in the number of BRC-20 transactions since the beginning of May, with a peak of 366,000 transactions and a fee of 22.5 BTC.
In total, there were more than 2 million BRC-20 transactions with fees of 109.7 BTC.
Recall that BRC-20 is the standard Ordinals token on the first layer of the Bitcoin network.
As we know, Stacks is the second layer of the Bitcoin network and is currently the only solution for scalability, which is why it has experienced the aforementioned price spike.

In conclusion, as long as the price of STX remains above the $0.4000 level, the probability of a rebound remains high.
On the other hand, if the price falls below the $0.4000 level, it could be worrisome for long-term investors.
The technical analysis also suggests that the price of Stacks is in the hands of bullish investors, and the price is showing signs of a bullish trend reversal.
The price of STX will gain positive momentum when buyers manage to break through the $1,000 level. Until then, the price may consolidate in a range with a bullish bias.
Consolidated trend for Crypto Balancer (BAL)?
Based on the latest data, we can see that Balancer‘s revenue has decreased in recent weeks, while TVL has slightly increased.
In addition, BAL’s technical indicators support a consolidated trend.
Recall that Balancer has a market capitalization of $352,325,559 and is ranked 110th in the cryptoverse.
However, BAL’s price is down more than 90% from its all-time high.
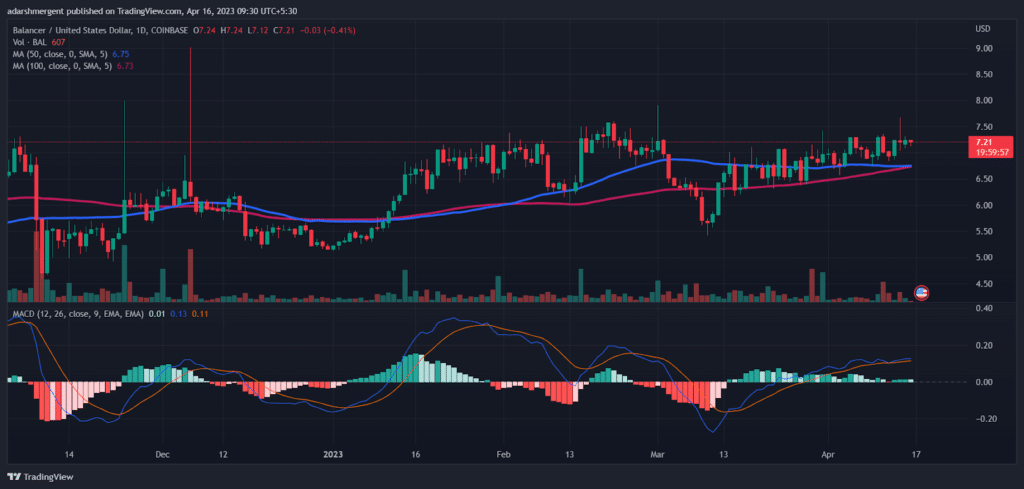
However, the weekly technical chart of BAL’s price suggests a strong consolidation. BAL’s price is currently stuck between $6.5 and $7.5, trading near $7.21, up 0.85%.
In addition, the upward trend in BAL’s price may come to a halt near the $7.6 level. Meanwhile, the downward trend may see a rebound from the $6.5 level. We also see that Balancer is trading above the 50 and 100 daily moving averages.
Thus, there may be a negative cross between the 50 and 100 DMAs that could push the price to a new low in the near future. However, BAL’s MACD is pointing to a weak upward trend in the future.


