


Bollinger bands are one of the most used and reliable financial indicators according to traders and are also applicable in crypto trading.
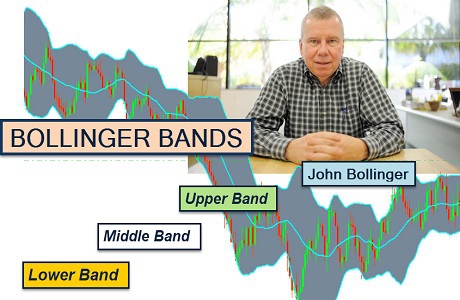
It is a well-known technical analysis indicator born in the early 80s, developed by the American John Bollinger, one of the pioneers of trading, to which he also dedicated a book called Bollinger on Bollinger bands.
Bollinger Bands: how they work
Bollinger bands are based on the volatility of an asset. Volatility can be seen as the standard deviation, statistically defined as the average squared deviation or the square root of the variation.
In order to calculate Bollinger bands, a moving average of X days is used, where X is usually given to 20, to which is added or subtracted the value of the standard deviation multiplied by a factor Y, where Y is usually equal to 2.
The upper band is then obtained by adding the standard deviation to the moving average F times. The lower band is calculated by subtracting the standard deviation from the moving average F times.
It can be seen that a larger width of the bands corresponds to high volatility, while a smaller width corresponds to low volatility.
Converging bands represent decreasing volatility. On the contrary, divergent bands represent increasing volatility.
Bollinger Bands: how to use them in trading
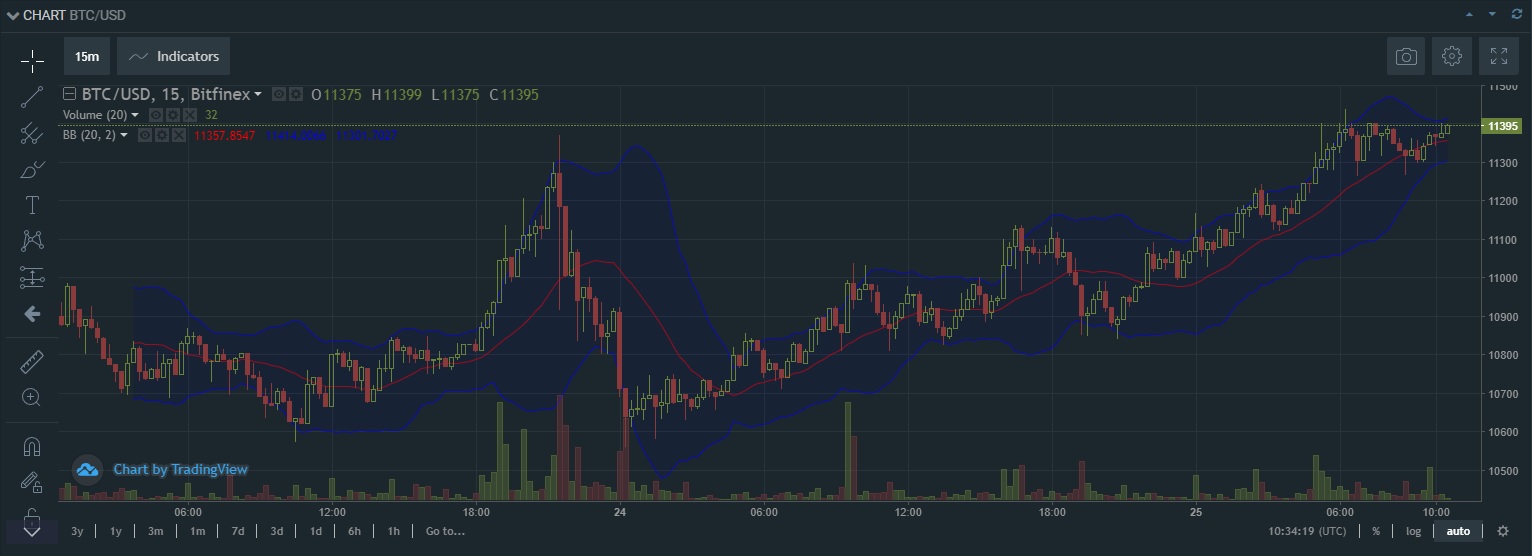
As can be seen in the graph showing the BTC/USD trend, the Bollinger bands are represented by a blue band. They are used by traders to try to pick up buying and selling signals.
More precisely, the occurrence of certain conditions alert the trader:
- If the price chart comes out of the upper band and then falls into it, a sales signal is obtained. This means that there has been a rapid increase in the price and probably there will be a subsequent slowdown or retracement;
- If the price chart comes out of the lower band and then falls into it, a purchase signal is obtained. This means that the price has fallen very quickly until it has stopped and will probably be ready to reverse the trend.
John Bollinger recommends not to change the length of the moving average but rather to switch from daily candles to weekly or monthly candles (for long-term trading) or to 1-hour or 15-minute candles (for daily trading).
In fact, Bollinger bands alone can generate false signals since for example, the chart could come out low, return and continue the downward trend. For this reason, it is recommended to use other indicators at the same time, such as the RSI indicator or the ADX indicator.
