


Like the stochastic oscillator, moving averages and ADX indicator, the CCI is also one of the most widely used technical indicators in the trading world. It stands for Commodity Channel Index.
The Commodity Channel Index (CCI) is widely used by traders, as it is simple to use and clear to interpret.
It was designed by Donald R. Lambert. The idea behind the oscillator is that financial instruments move in cyclical phases, with maximums and minimums alternating at periodic intervals. It is obtained from the current price ratio of an asset with a moving average usually with period 14. The ratio is then normalised using average deviations.
Commodity Channel Index (CCI)
It takes 4 steps to calculate it:
- The typical price is calculated (TP)=(H+L+C)/3 with H=maximum L=minimum C=closure;
- The simple moving average at “n” periods of the typical price (SMATP) is then calculated;
- Then the average deviation is determined. The first step is to determine the absolute value of the difference between the SMATP of the last period and the typical price for each of the “n” past periods. Then all these absolute values are added up and divided by “n”;
- The last step is to apply these calculated values and the constant (0.015) as indicated in the following formula:
CCI = (TP – SMATP) / (0,015 * devmedia)
Clearly, all the exchanges that allow this indicator to be used perform the calculation of the CCI in a transparent way to the user, therefore it is not necessary to carry out the calculations but it is important to know how to read the final chart.
The range of useful values of the CCI is in the region between -100 and +100. The CCI then moves above and below zero; the percentage of oscillator values in the -100/+100 range will depend on the number of periods set: a shorter CCI will be much more volatile and consequently will have a smaller percentage of values in that range; on the contrary, the more periods will be taken into account the higher the percentage of values in the range.
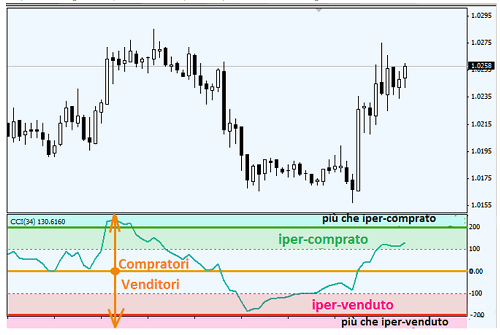
An overbought area is where the CCI goes over +100 while an oversold area is where it goes under -100.
In the image below you can see the CCI applied to the BTC/USD graph for the last few days.

It is also possible to consider larger overbought/oversold areas, for example between -200 and +200, for greater accuracy.
