On a day in which no particular interesting signs emerge, the best rise among the first 100 cryptocurrencies is that of Wanchain (WAN) which rises by 32% and brings the price back over 50 cents, a level abandoned in November 2018.
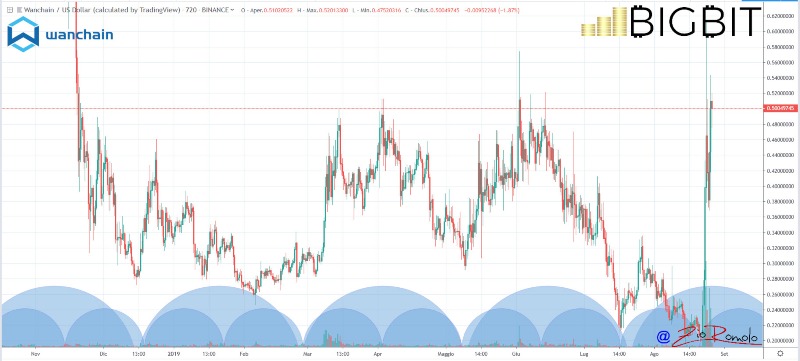
Throughout the first half of this year, the price of Wanchain has fluctuated just below the threshold of 30 cents. With this rise, Wanchain climbs the CoinMarketCap ranking and with 54 million dollars of capitalisation conquers the 87th position.
Wanchain is an interesting token related to the project aiming to aggregate the trade of the various tokens within its ecosystem of private and decentralised blockchains; it aims to be an alternative financial market dedicated to the cryptocurrency sector.
In contrast, the worst downturn of the day is a position above Wanchain and it is ABBC Coin (ABBC), in 86th position, which loses 16%.
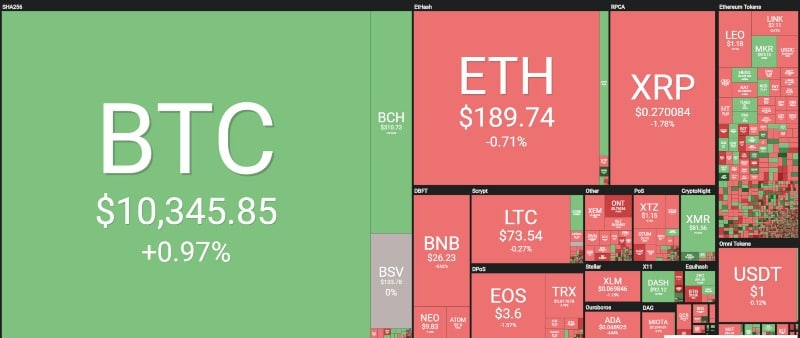
The day that opens the last week of August is an alternation of red and green signs. The red signs prevail slightly with just over 60% of cryptocurrencies in negative territory.
Looking at the first 20 of the ranking it is possible to notice the alternation of colours.
The weekend had begun with some concern considering the trend of last Friday that had the potential to push prices down, but the weekend has passed with mediocre trading volumes which have not changed the structure of the major cryptocurrencies.
Bitcoin, however, continues to give strong signs of holding the psychological threshold of 10,000 dollars.
Among the falls of today’s day, there is that of Ren, -8%. After the important increases of last week, in these last days, REN is experiencing a retracement and today is among the worst-performing coins.
Algorand (ALGO) continues to descend, currently in 43rd place. Both Cardano (ADA) and Basic Attention Token (BAT) are trying to contain their falls, both losing more than 5% today.
The last 24 hours recorded an increase in volumes of 30% despite the fact that it was the last Sunday of August, with trading volumes reaching over 70 billion dollars, revising a strong level after having reached a low in recent days, just below the threshold of 50 billion dollars on a daily basis.
The market cap goes up again and reaches 270 billion dollars. The dominance of bitcoin remains anchored at 69% of the market share at the expense of Ethereum and Ripple.
Despite the modest recoveries of recent days, Ethereum remains just above 7.6% of dominance, while Ripple remains at its lowest level of the last year, at 4.3%.
Bitcoin (BTC)
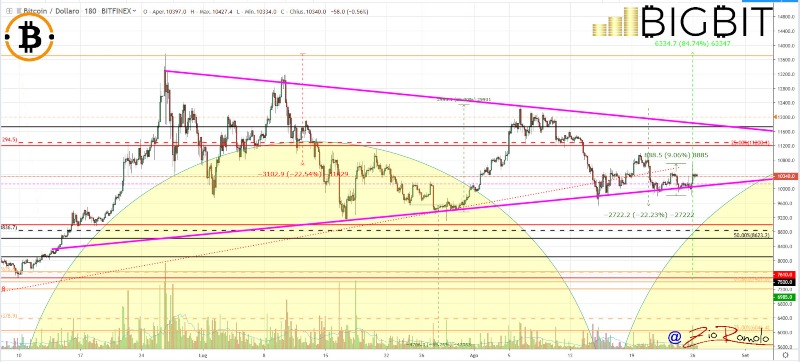
Bitcoin prices continue to fluctuate within the triangle which confirms the stability of the support level. To have more bullish indications it is necessary for bitcoin to consolidate above 10,500 dollars, levels to which it tried to approach last Friday without particular success.
In the current technical context, it is necessary for bitcoin not to go below $10,000. Sunday’s break that prompted prices to test $9,800 was overcome with new purchases that brought prices back to $10,000.
To repel the bearish clouds, it is necessary for bitcoin to resume quota 11,200 dollars. A possible break below 9,800 could attract downward speculation.
Ethereum (ETH)
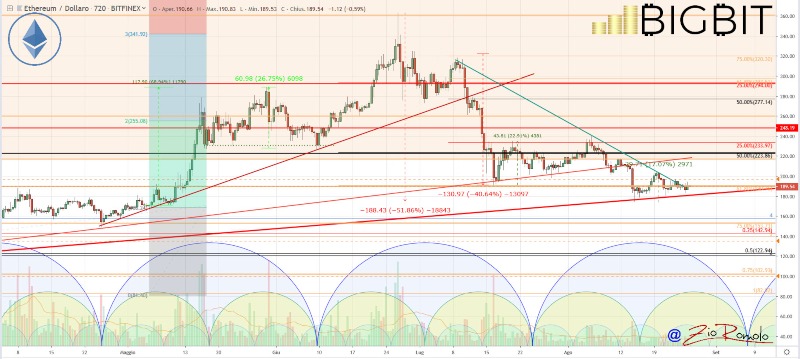
Ethereum continues dangerously swaying in the $190 area. For 15 days ETH has abandoned the psychological threshold of $200.
After having timidly tried last week to get back above this level, it failed to give a clear sign of countertrend.
It is necessary for Ethereum to return over $200 to give clear signs of wanting to rise and to be able to aspire to the next levels of resistance between $225 and $235. On the other hand, the repeated test of the support levels, which weakens the very holding of the support, becomes very dangerous for the bullish trend.


