In today’s predominantly negative market for the crypto sector, Zilliqa’s countertrend stands out, earning 14%. However, it is a figure that should not be misleading: Zilliqa has recorded this rise on a single exchange, Bithumb, where the prices of ZIL are 10% higher than those of the other exchanges, where it is priced at 0.005 dollars.
It is precisely on Bithumb that the trades that are influencing the price of Zilliqa are concentrated. So it is not a rise agreed upon on all the exchanges. It is worth remembering that the founder of Zilliqa abandoned the project a few weeks ago and this made Zilliqa vulnerable from a speculative point of view.
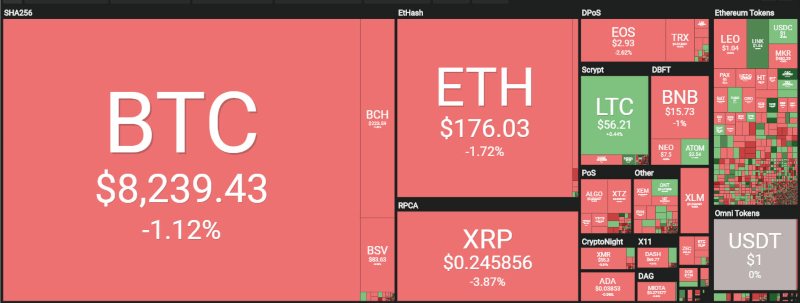
It’s a fluctuating period for cryptocurrencies. For the 5th consecutive day, the market opens in sharp contrast to yesterday, with a clear prevalence of negative signs. More than 70% of cryptocurrencies are preceded by negative signs.
Among the top 20, there is only one green sign: it is Chainlink, in 17th position with a climb of over 8%. Chainlink with today’s climb is among the top five of the day.
Negative signs prevail in the rest of the sector, with a fluctuating trend, as though investors were looking for places to resume purchases. A clear sign of this comes from the low volumes: trading in the last 24 hours has fallen back to below 50 billion dollars. This shows that, after last week’s drops, there is still no interest from investors, as shown by the daily trading below the average of the last few months.
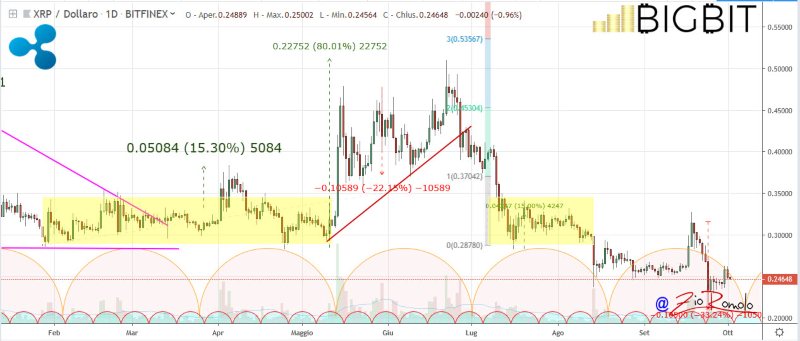
Among the first three, Ripple is the most penalised with a loss of 3%. Ethereum and bitcoin lose one percentage point.
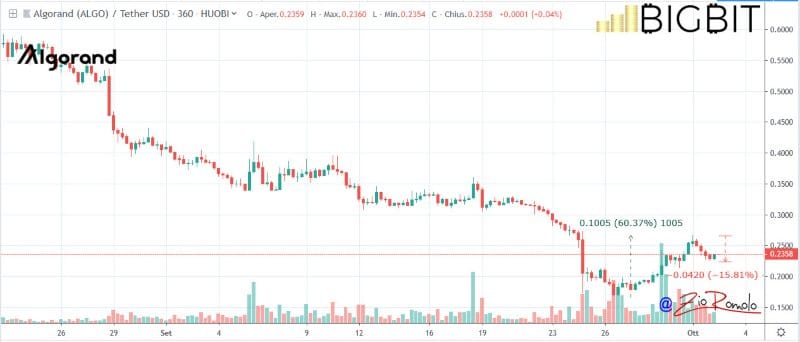
Among the worst of the day, there is the negative sign of Algorand (ALGO), which lost 5%. After reacting to last week’s downturn, with prices rising to an all-time low on September 26th with prices falling to 17 cents, the last few days have seen a price reaction that has returned to test the 25 cents of a dollar, but the structure continues to remain in a bearish channel.
The capitalisation remains at the levels of the last few days, although it tries to resume the 220 billion. The dominance of bitcoin remains unchanged since yesterday, at about 67.5%. Ethereum’s recovery is modest, earning a few fractions of a decimal place and rising to 8.7%. Ripple retreats, failing to recover the 5% regained on September 30th, and today is at 4.8%.
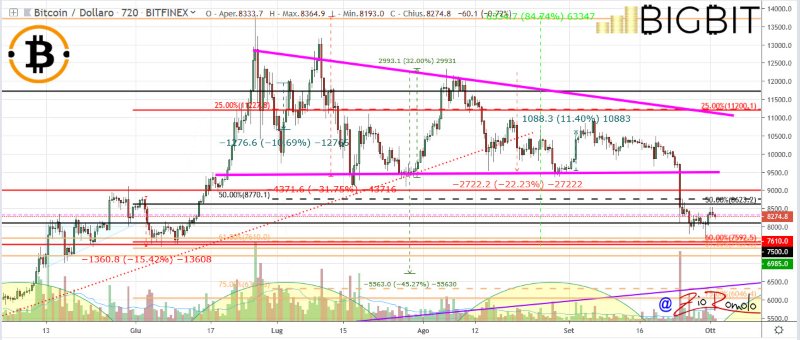
Bitcoin (BTC)
Bitcoin fails to exceed the 8,500 dollars, which was attempted yesterday, staying now at just below the 8,300 dollars. Looking at the trend of the last week, the operators seem to be looking for support levels from which to start again.
If this does not happen, a break of the $7,600, the levels tested about a week ago and between Sunday and Monday, could trigger speculation again pushing prices down in the $7,200 area, where the bullish trendline that supports the technical movement passes. The currently valid bullish structure, which began with the lows of last February, meets the first point of contact at the end of March 2019. It is necessary to find a new point of contact in the next few days.
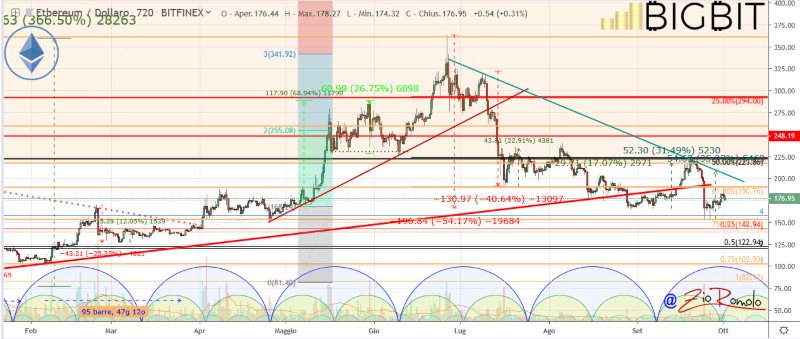
Ethereum (ETH)
Ethereum fails to secure the 185 dollars, a crucial level to consolidate in order to attempt the attack at 200 dollars. Today, ETH is falling back to 175 dollars and it is necessary not to go below the minimums tested last week at 155 dollars. In case of violation of this threshold, the neutral uptrend would be compromised by shifting to a bearish trend that could lead prices to revise the $125, left behind last March.
On the contrary, ETH must reach 185 dollars and then aim for 200.


