Increases the correlation between Bitcoin and gold. After the lows recorded in mid-March, between 13 and 16 March, they both returned to a specular trend. Although the intensity of gold at this time is better, so much so that allows the gold, with the leap of the last 10 days, to return to a positive balance since the beginning of the year with a gain of over 6%.
On the contrary Bitcoin, despite having recovered a lot of ground from the mid-March declines, with a pullback between 60% and 70% value recovery, since the beginning of the year marks a negative balance with a loss of about 12%.
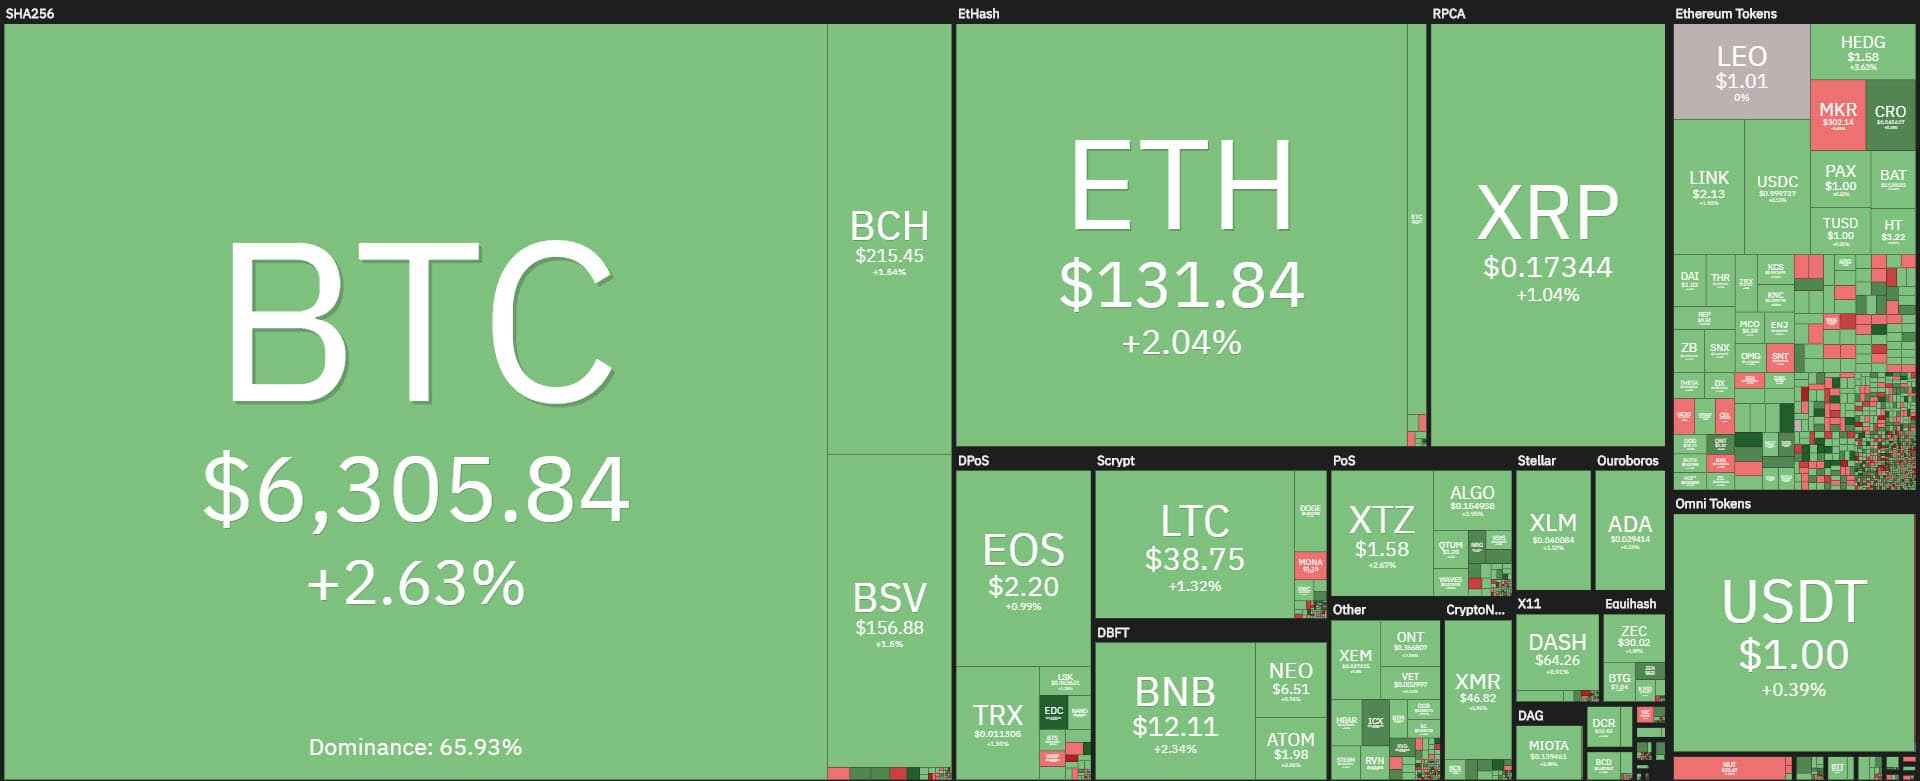
In general, today the week starts in green. 8 out of 10 are the cryptocurrencies above parity with increases that can’t extend beyond the double digit, but still give a signal of a desire to reverse after the weekend has passed with a particular weakness that has brought most cryptocurrencies to test the short-term media.
The movement that is developing in these early hours of Monday brings back exactly the values to where we left them last Friday.
It should be noted that, after 21 days, the longest strip since December 2017, when the value was much higher than the current one with important upward movements, Bitcoin traded in value just under $1 billion dollars. The trades however remain well above the average of the last quarter.
The week we left behind was the third consecutive week with a bullish trend for Bitcoin and the second for Ethereum.
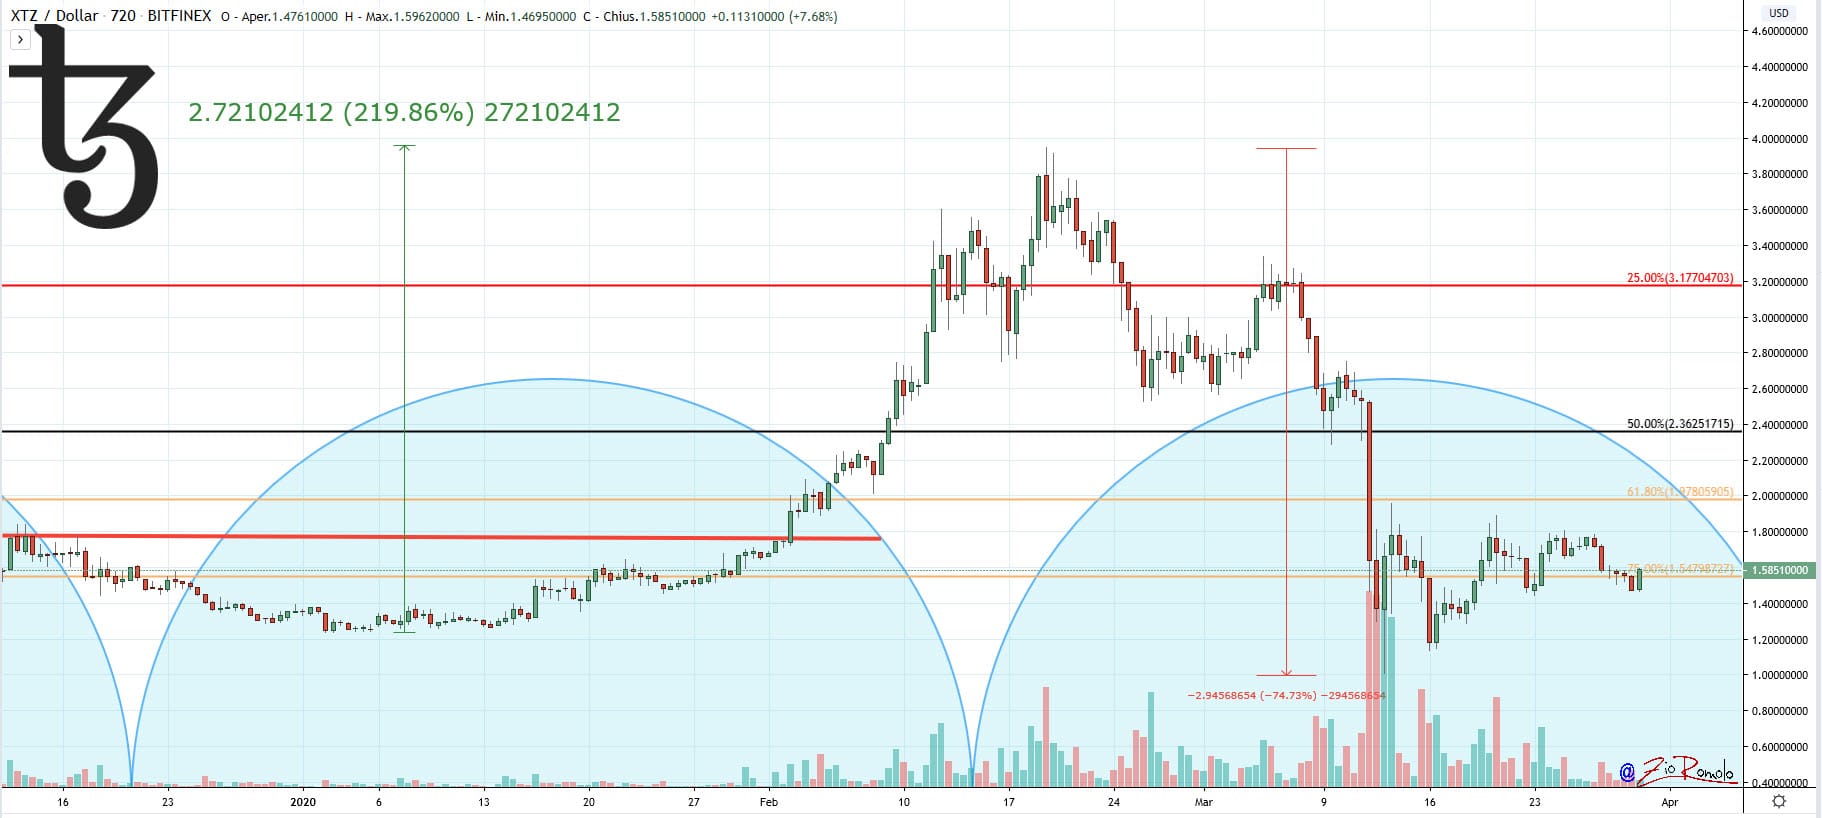
Among the big ones today stands out particularly the rise of Tezos (XTZ), the best of the top 20, followed by Crypto.com Coin (CRO) jumping in 19th position with a leap of more than 7% over the capitalization of Dash (DASH).
Tezos with a leap of 2.5% on a daily basis tries to recover the ground lost in recent weeks by consolidating the 10th position, followed by Leo’s token (LEO) that in recent days has recovered the parity threshold with the dollar.
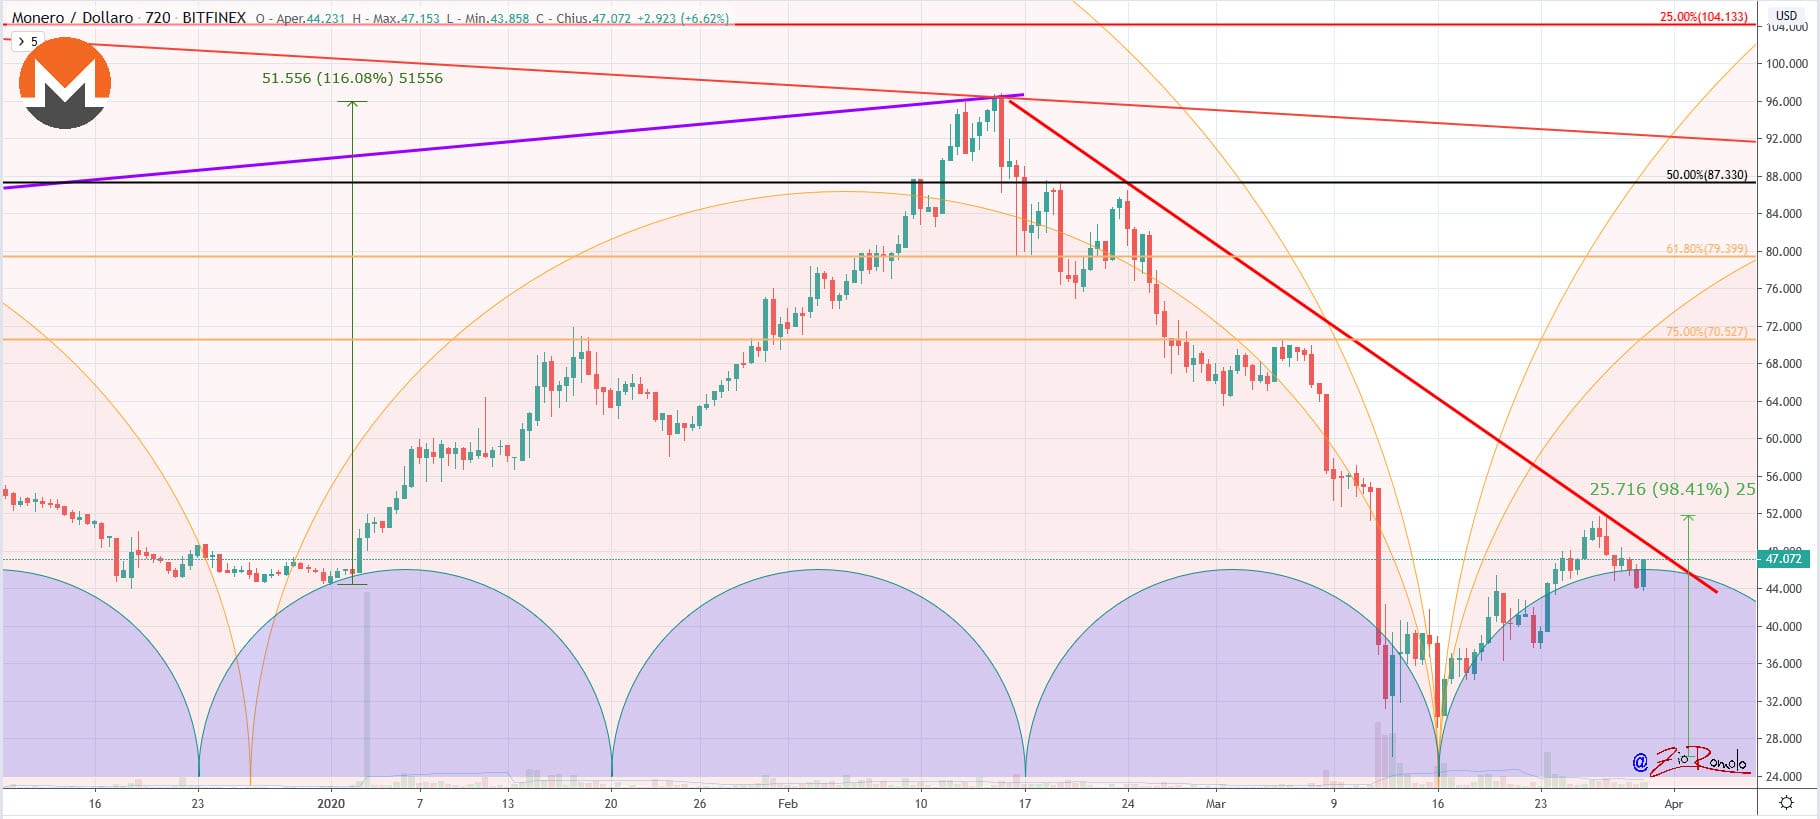
In 12th position Monero (XMR) with an increase of just under 2% marks one of the clearest trends of a possible reversal in the medium term. In fact after having touched the minimums in coincidence with all the rest of the sector the 13 of March, the trend of Monero is marking higher minimums and maximums, so much that the rise that has accompanied the tops of short period of Friday with prices returned again above the $51 dollars, is one of the trend better set between the bigs with higher minimums and maximums.
The capitalization remains at the levels of recent days, at $175 billion, as the dominance of Bitcoin at 65.5%, last Friday’s levels. Ethereum also sees the dominance unchanged, at 8.3%, while it recovers XRP that, thanks to the price jump over the weekend, regains 4.3% market share, the highest level of dominance since mid-February.
Among the altcoin, just Ripple together with Monero mark the best increase on a weekly basis, with a gain of over 15%.
Bitcoin (BTC)
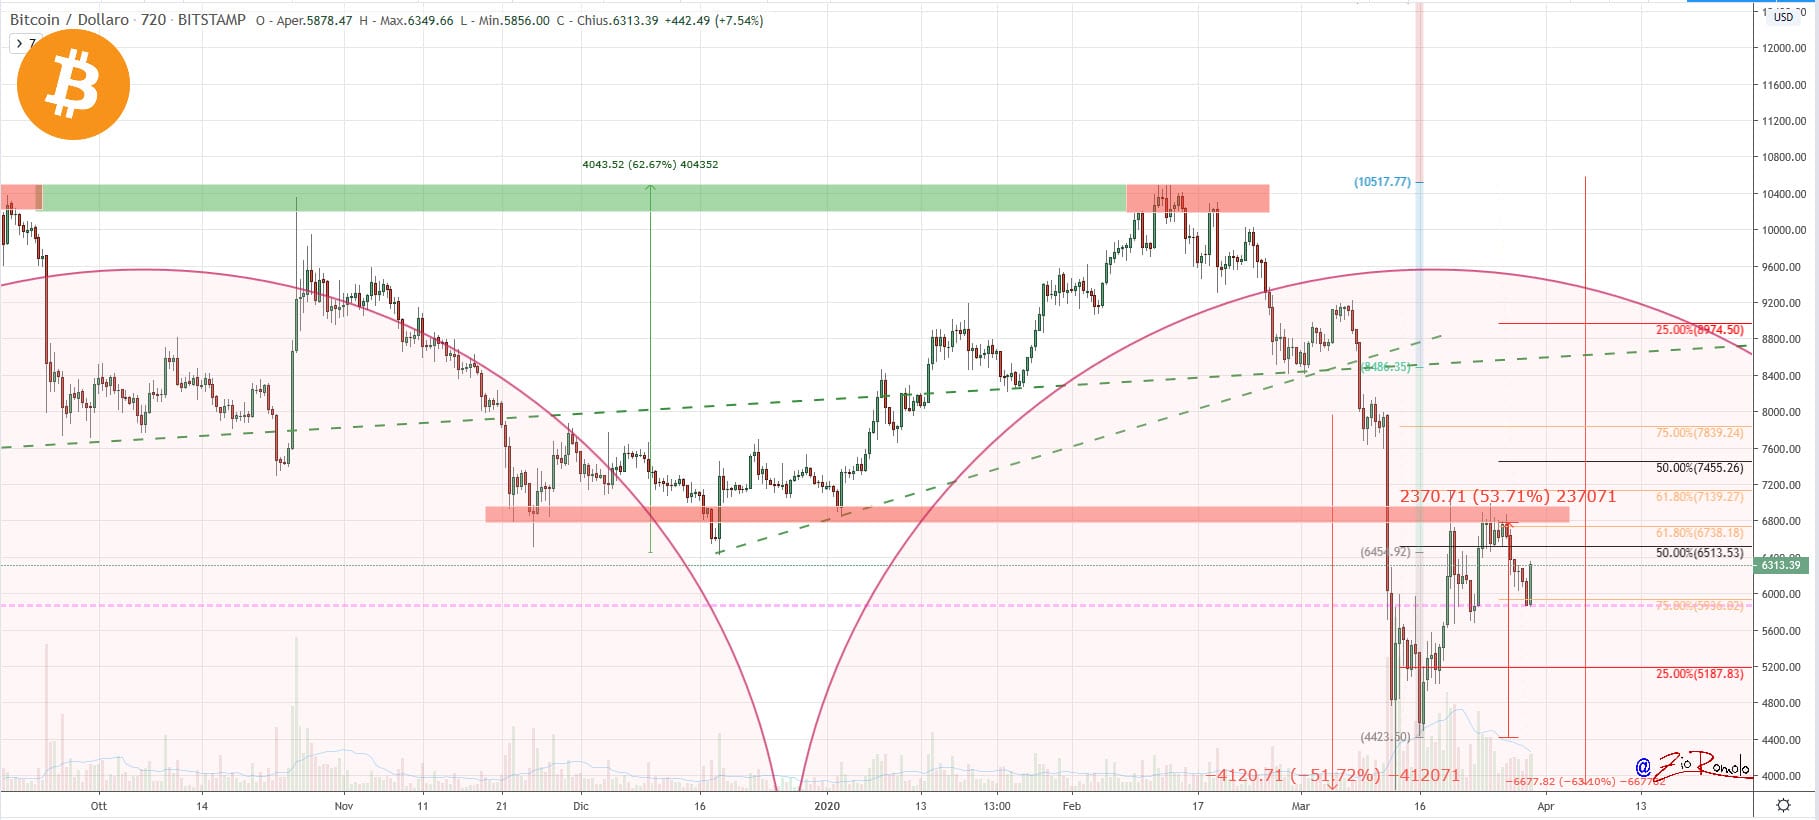
Bitcoin confirms that it is close to the closure of the bi-weekly cycle started by the double minimum between March 13 and 16. The downward movement that characterized the weekend is part of a retracement context in line with the closure of the two-week cycle.
In the coming hours it will be important to validate the lows recorded yesterday, Sunday, where prices have seen a plunge below the psychological threshold of $ 6,000, recovered in the following hours. A minimum that corresponds to a support level of about ten dollars higher than the lows recorded exactly the previous weekend. A feature that highlights how currently the relative lows of the period were recorded both times over the weekend.
For Bitcoin it is necessary to recover the $6,600 as soon as possible in order to return to give a first bullish signal. A break above this level would most likely push prices to a new short and medium term high.
Ethereum (ETH)
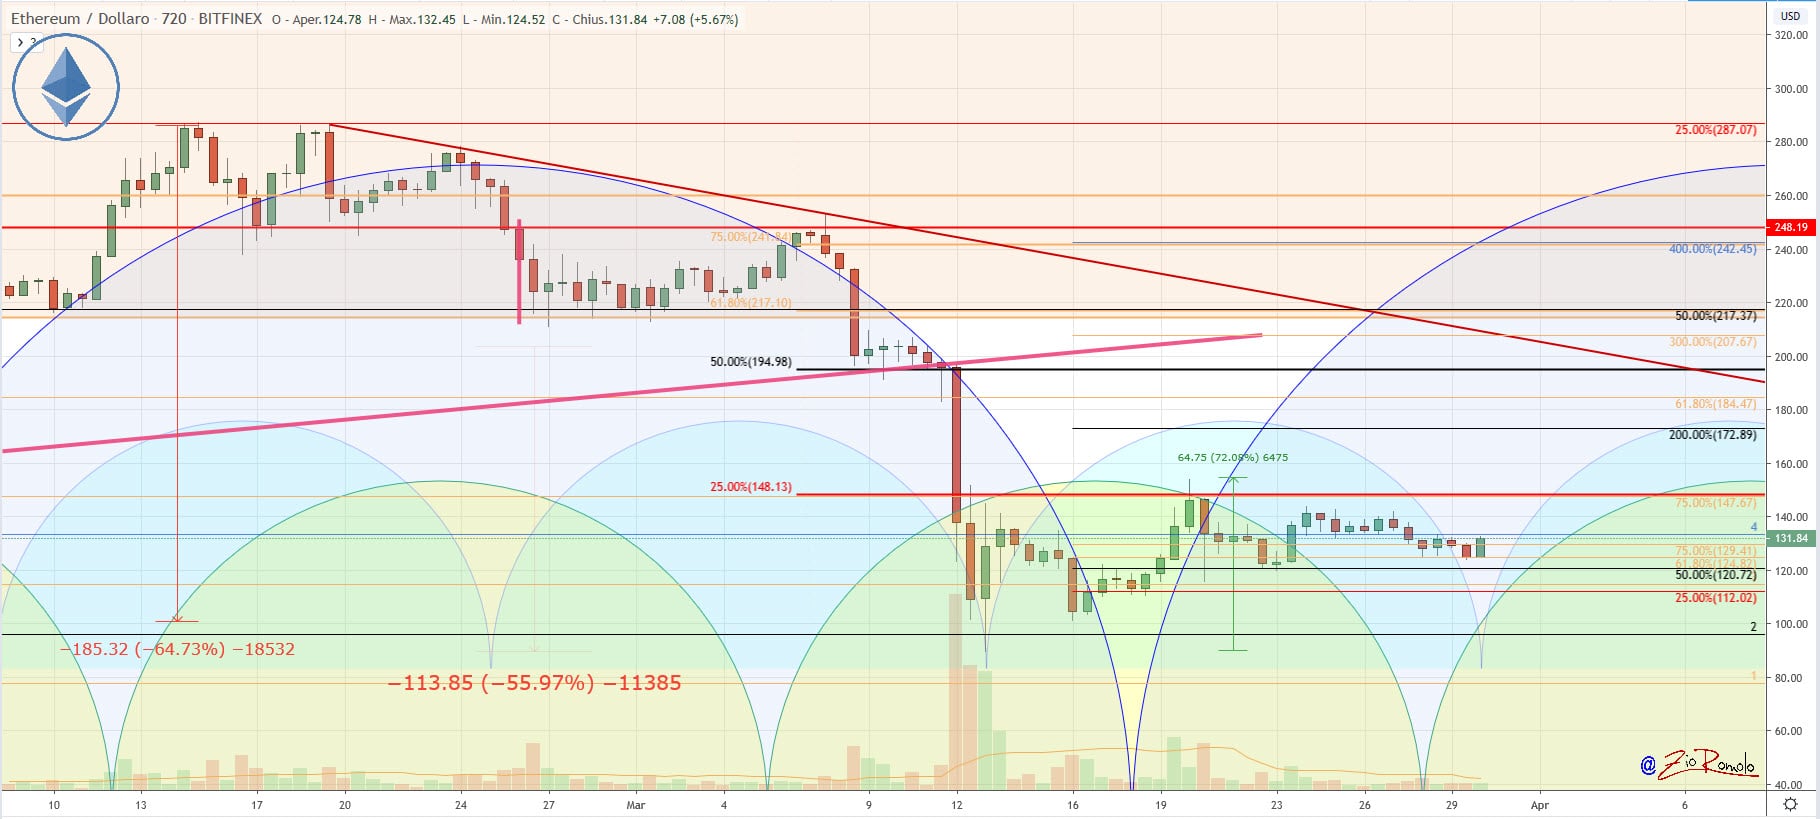
Ethereum confirms the $125, fluctuating at $130. But, unlike Bitcoin, it is having a bullish trend characterized by low purchase volumes and a decidedly congested volatility, and prices that have been moving since last Monday in a very narrow range.
Even for Ethereum is technically close to a bi-weekly cycle closure. It will be very important for ETH to recover the $140 as soon as possible and to go with the volumes above $145 and then $155.
A drop below $120 dollars would continue to give Ethereum a bearish signal.


