Today is the fifth consecutive day on the rise for Bitcoin. If this trend were to continue over the next two days, it would be the third consecutive week with a green sign, a week with a positive balance, which statistically has not been recorded since the end of December and the beginning of January.

In particular, the day sees a prevalence of green signs with over 80% in positive territory. The big ones see only one red sign among them, that of the LEO token, which continues to stay above the threshold of 1 dollar, but today retraces 1%.

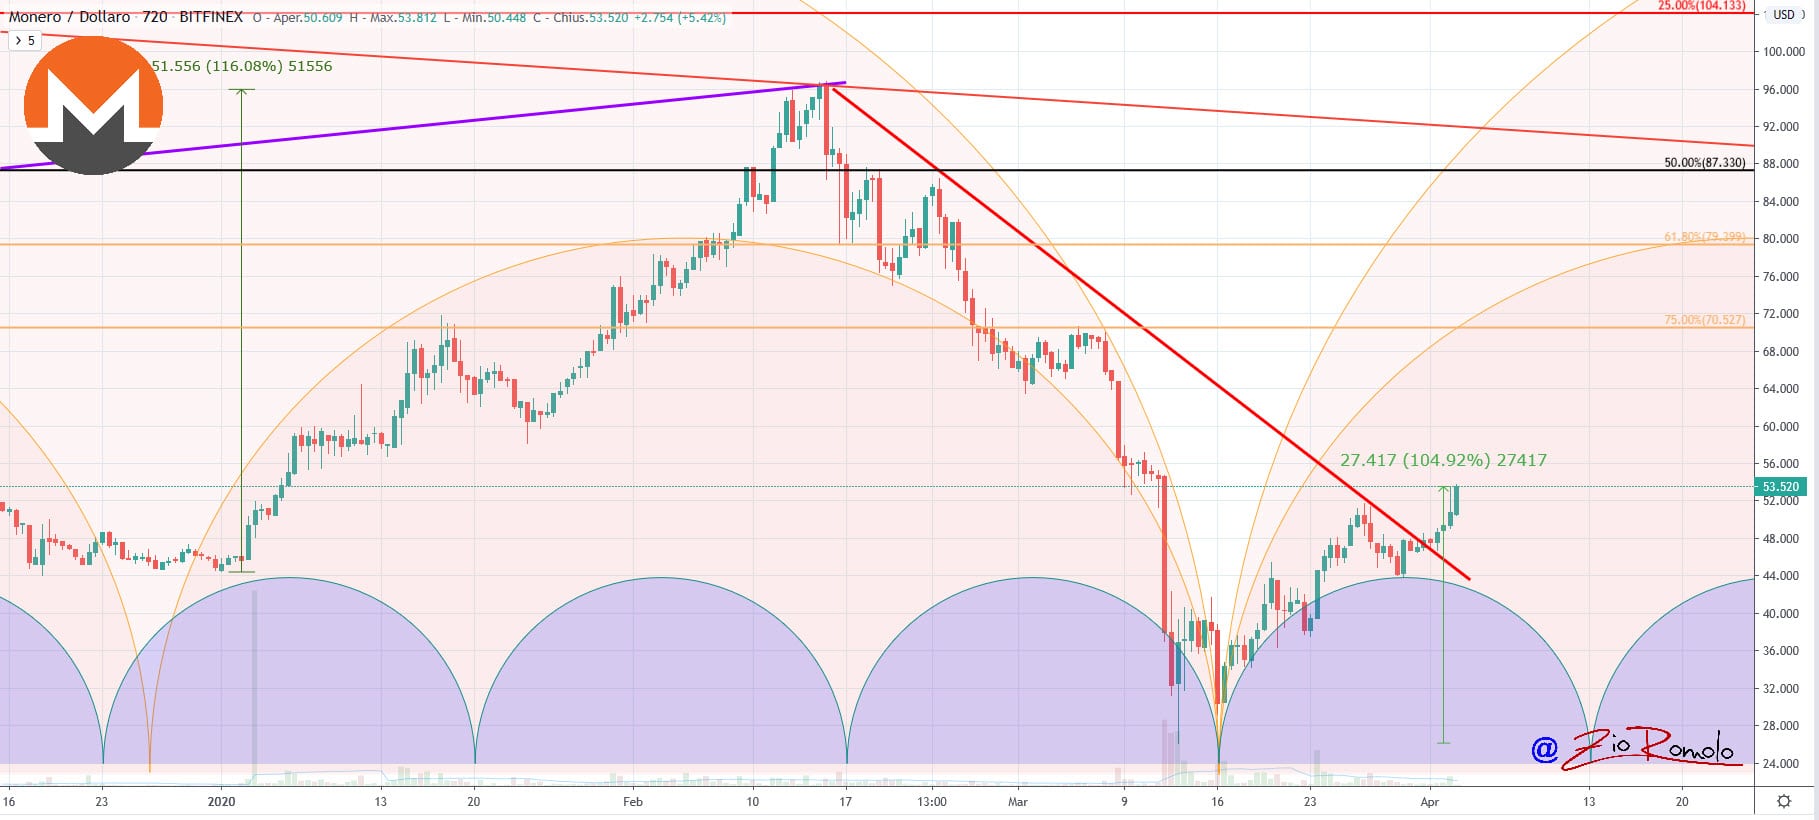
Among the major names, the climb of Monero (XMR) stands out, which is close to 10% on a daily basis. Monero continues to consolidate the bullish trend that has been characterizing it in recent days, bringing it back to a respectable position, reaching 12th position in the ranking of the most capitalized, just over $100 million from the LEO token, which is in 11th position.
The day’s rises continue to give a good signal for Bitcoin which, unlike yesterday, when it was among the top 10 of the day, today continues to support the rise with a climb of almost 4%. A 4% surpassed by Ethereum on a daily basis.
Today’s rise benefits, in particular, the second part of yesterday, which in the afternoon saw strong rises in a time slot that marked double-digit increases for all the top 10 in the standings.
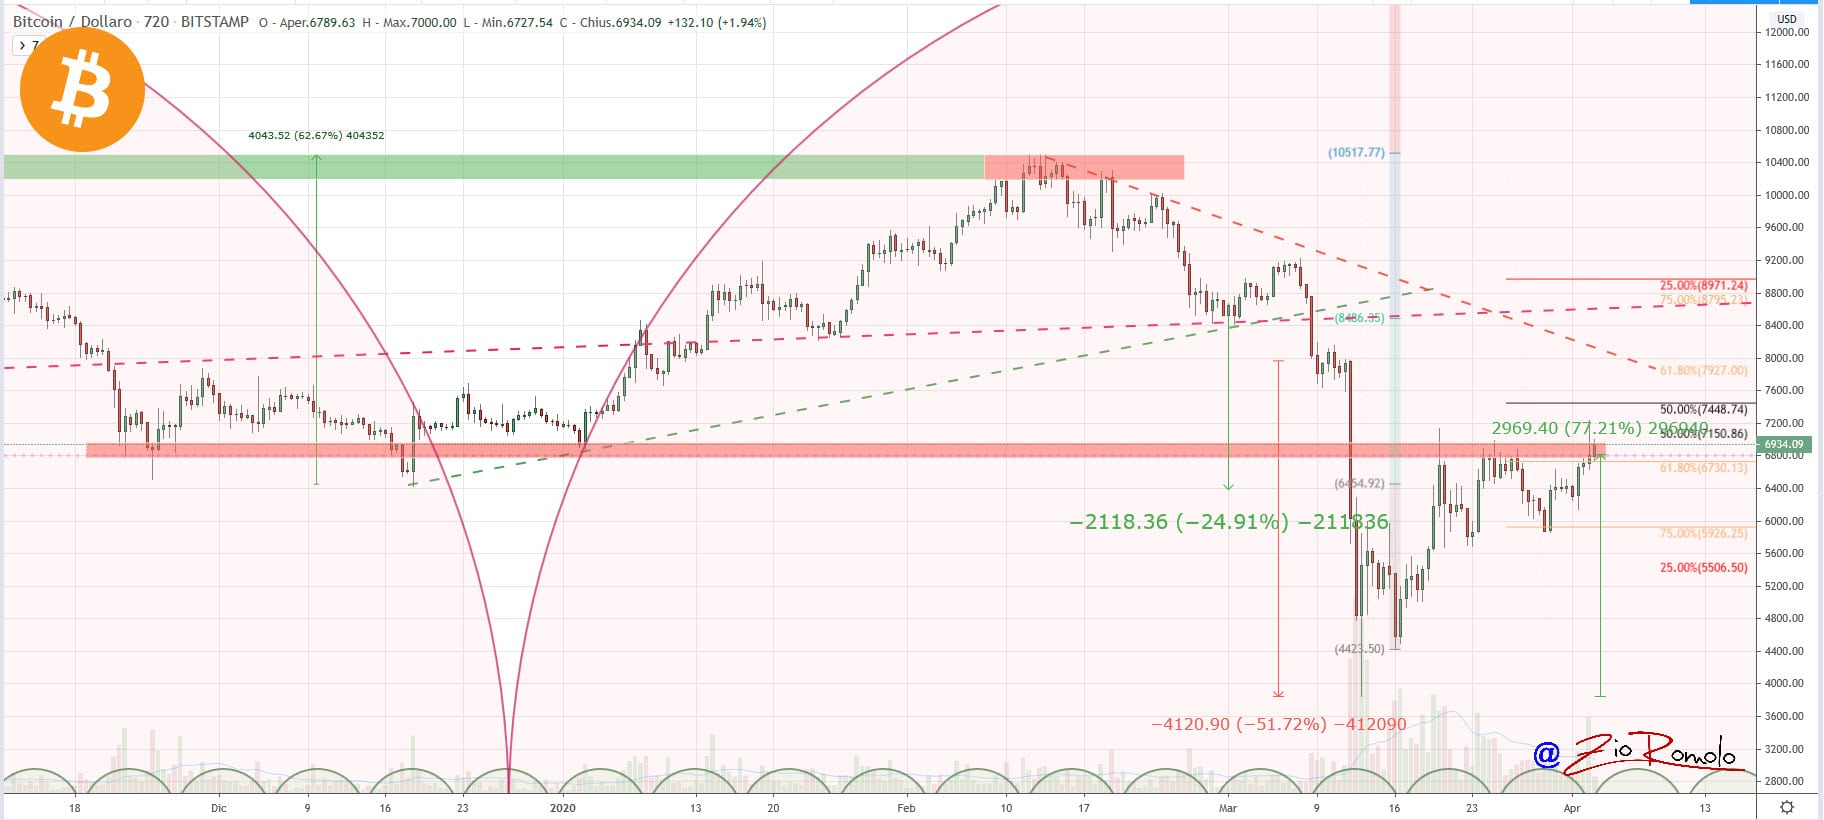
Bitcoin led the rise, which then flattened out over the next few hours. A rise that for most cryptocurrencies, like for Bitcoin which always marks the pace, updates the highs of the last three weeks, pushing beyond the resistance threshold of $6,800, formalizing the start of a new cycle set upwards during these hours, which will have to be confirmed over the weekend.
Trading volumes are dropping to around $90 billion. Bitcoin, after the break at the beginning of the week, returns to oscillate around volumes with a counter value of 1 billion dollars, this continues to highlight how the moment is attenuated and gives signs of movement not only of prices but also of trading volumes.
A trend with such a long period of relevance, over 20 days, has not been recorded since 2017, with exchanges sustained in the last 24 hours, with an intensity equal to 1-1.5 billion, although in 2017 Bitcoin had twice the current levels. These are therefore important signals that can be a reference for the coming weeks in particular.
Total capitalization benefits from this further increase reaching more than 190 billion and approaching the threshold of 200 billion abandoned in mid-March. Bitcoin maintains over 65% dominance. The increase of the last few hours does not change the market share of Ethereum which remains at 8.2% and XRP at 4.1%.

Bitcoin (BTC) on the rise
With the break of $6,800 in the second half of yesterday, Bitcoin saw strong downward coverage of positions take off and prices soar to over $7,200 before falling back to $6,800.
As of this morning, prices are moving in the range of $6,800 and $6,900. In the short term, the $6,800 is a support base that if confirmed it could give a boost over the weekend that would put behind the strong movement experienced between March 12th and 13th, which registered one of the most violent declines in a short time, with a collapse of about 50% in 48 hours.
A recovery of $7,800 in the next few hours or days would really give a signal that would restore confidence for Bitcoin, which at this time continues to be at an all-time low.
A negative signal would come with a fall below $6,000-5,800, impacting the mid-term uptrend that started from the March 16th low.

Ethereum (ETH)
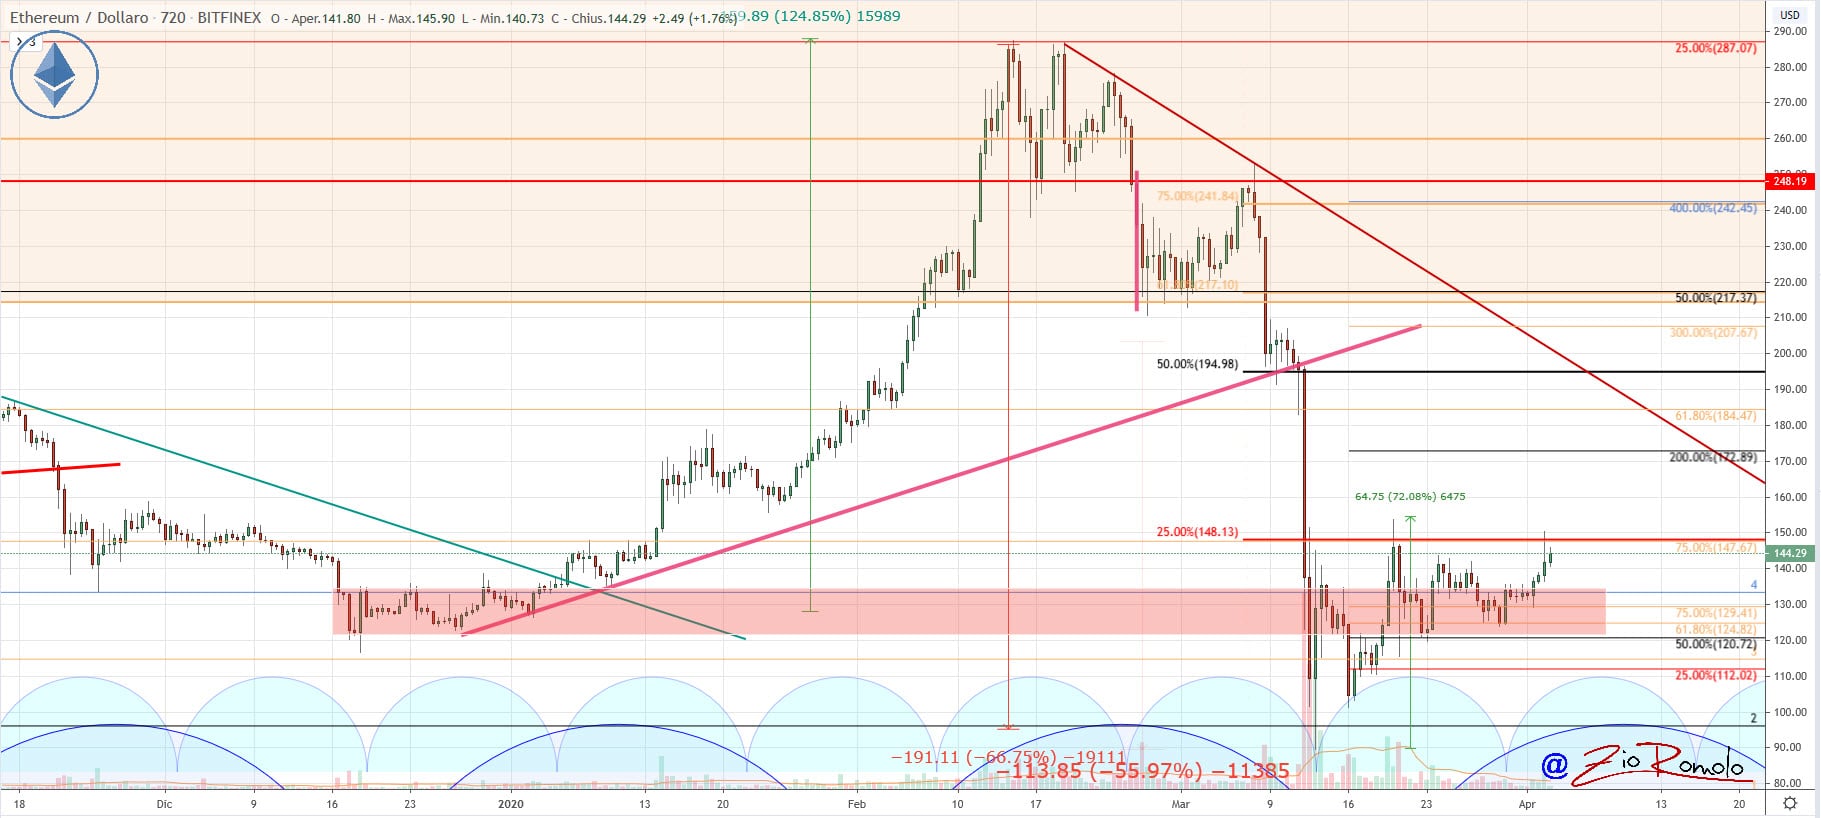
Ethereum benefited yesterday from the bullish momentum, pushing to review the $150, a level that last March 20th had pushed the pullback after the sinking a few days earlier. Even if the intensity is lower than Bitcoin, ETH is trying to move away from the clogging, the swings and the congestion that has characterized much of the week with prices that have oscillated between 130 and 135 dollars.
Today prices are testing at $145, a resistance threshold that if confirmed with a break in the next few hours, would push Ethereum to update the highs of the last three weeks.
A positive signal would come with the extension to $155. A negative signal for Ethereum would come with a break of $125, an area of support that has characterized the last two weekends.


