The uncertain market situation seems to strengthen the stablecoins market cap.
After the tensions on Monday, which saw the US WTI oil price close in negative, even yesterday, after the closing of the May contract, tensions shifted towards the June futures which in a few hours fell below $13.
The tensions are increasing more and more and, if they continue as feared in the coming weeks, this will affect other financial market assets and could also involve other commodities.
These tensions have also put the stock markets in the US and Europe under further pressure yesterday, not only because of what is happening with US crude oil but also because of the problems that persist in the management of the economy.
The Covid crisis seems to have been almost a pretext to blow up what had been boiling for several months, if not years.
In such a tense period, people and even non-professional investors are resorting to stability of their capital, so much so that gold has reached the highest in the last 8 years, rising last week to 1,780 dollars recorded on April 14th.
Gold has also seen a decline in recent days with returns below $1,700, but it remains the main safe-haven asset.
In addition to gold, investors are also looking for protection in fiat currencies, which seems to be the fastest method in these cases. This is why the strongest currency in the world is used.
As a result, the dollar strengthens but at the same time its liquidity decreases. Other assets may find a reason to grow stronger within such a context. Stablecoins, for example, in the last 2-3 weeks see the total market cap in their sector exceed $9 billion, an absolute record.
The ease of moving fiat currencies in the form of stablecoins in this period of high tensions finds more and more application and this makes them exceed the 9 billion capitalization, with Tether that considering yesterday’s record, holds 84% of the market cap with its 7 billion dollars.

Today, after the declines of the last few days, sees the green signs return again. The positive signs prevail with 70% of cryptocurrencies in green, not real rises but a reaction from yesterday’s setbacks.
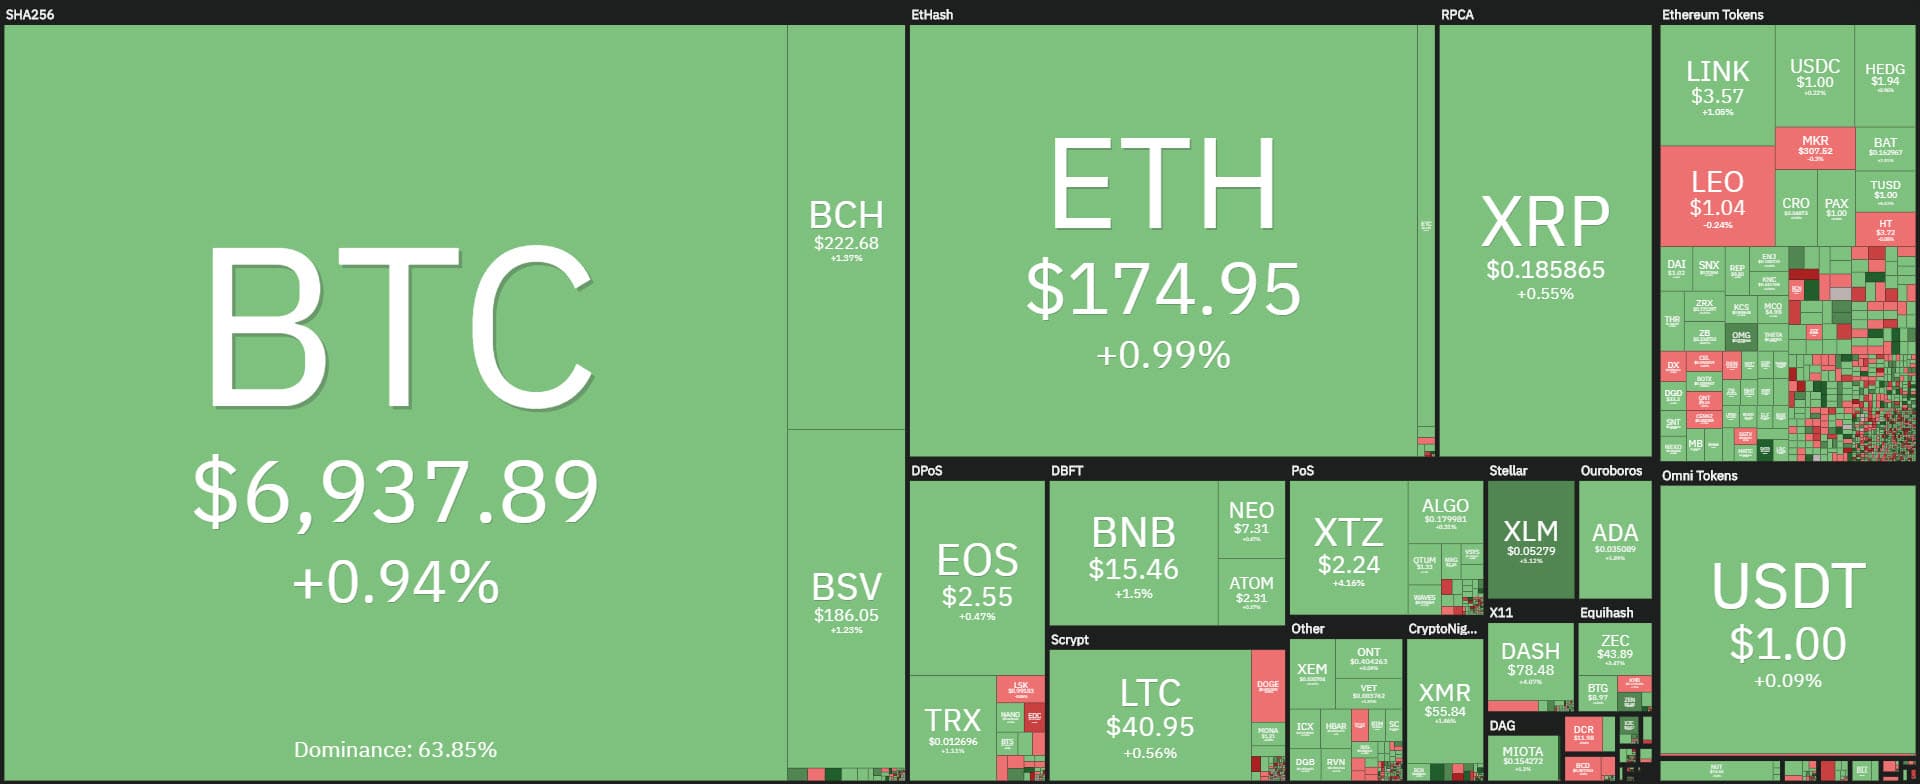
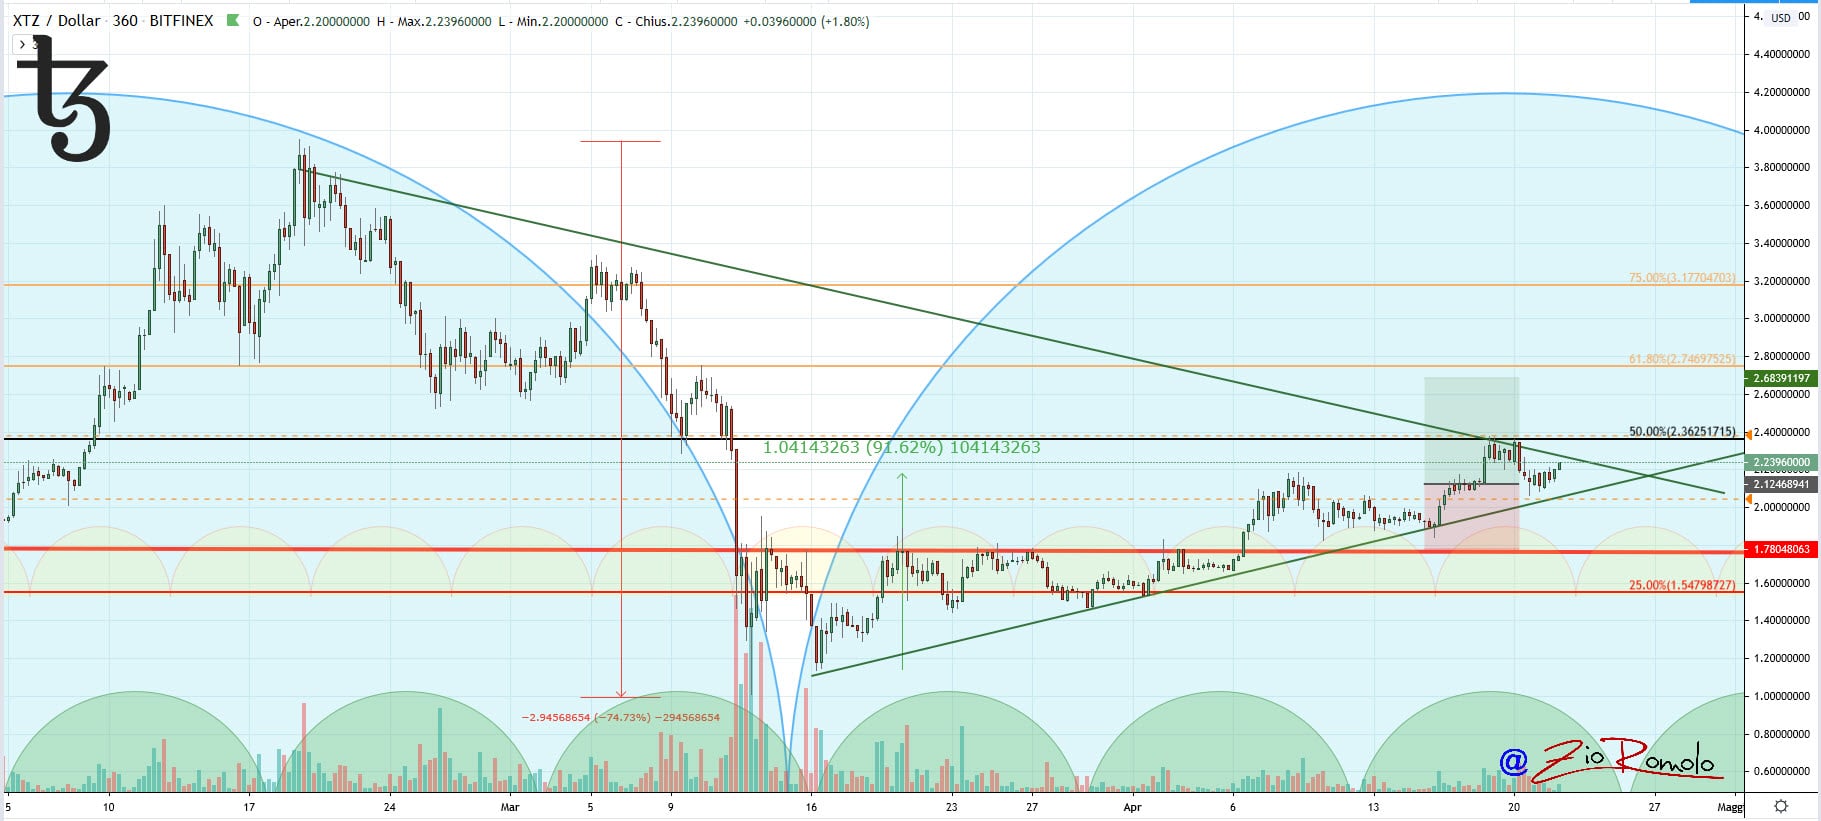
Among the top 10, the red and green signs are balancing out. Bitcoin (BTC), Ethereum (ETH) and Ripple (XRP) are in negative territory, with moderate declines that do not go beyond 0.5%, while in positive territory there’s Tezos (XTZ) which rises above 1%.

Enjin Coin (ENJ) continues to perform well and today continues to climb with a jump of over 4%. Among the top three of the top 100 there are also DigiByte (DGB) with +8% and Status (SNT) with an increase of about 5%.
Today’s increases allow the total capitalization to return to close to 200 billion dollars.
The dominance of Bitcoin, Ethereum and Ripple remain unchanged from the levels of the last 48 hours.

Bitcoin (BTC) price
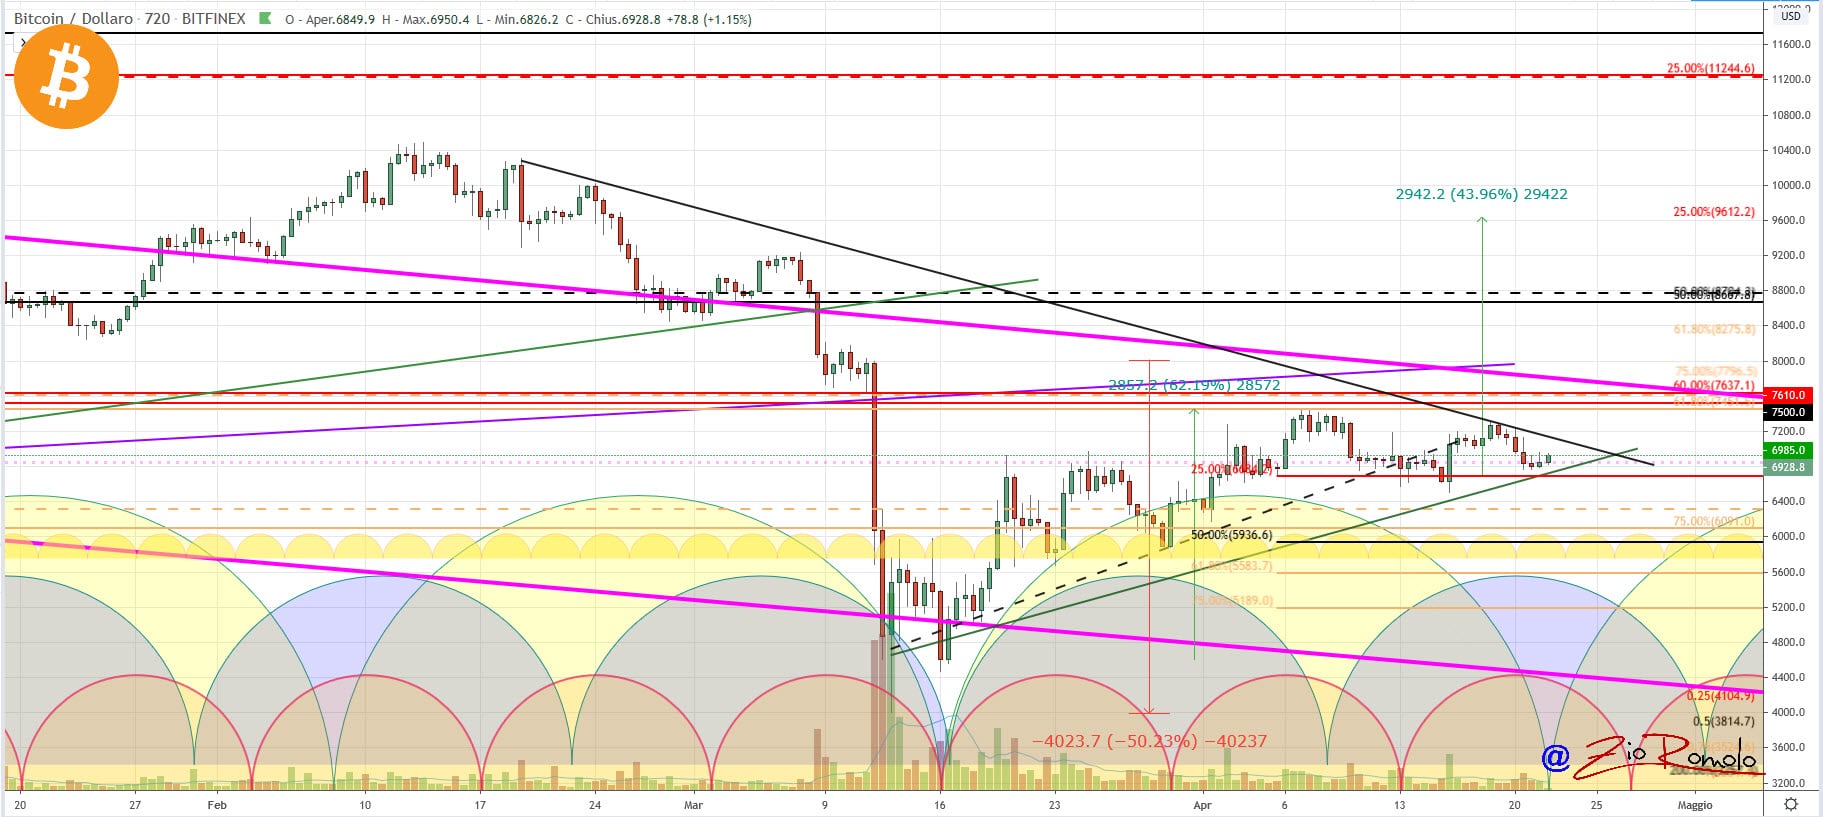
Bitcoin returns to react to the bearish movement that has characterized the prices of the last 3 days and today tries to recover the $7,000. For Bitcoin, from a bullish point of view, it is necessary to go beyond the $7,150 as soon as possible.
In the case of a violation of yesterday’s lows and specifically of the 6,750 dollars, there would be room to revise the 6,500 and then in the event of a further sinking begin to evaluate the possibility of closing the current monthly cycle with a greater degree of depth than assumed and with a maximum extension that must not go beyond $5,900, otherwise, it would open a delicate and dangerous phase a few days after the halving.

Ethereum (ETH)
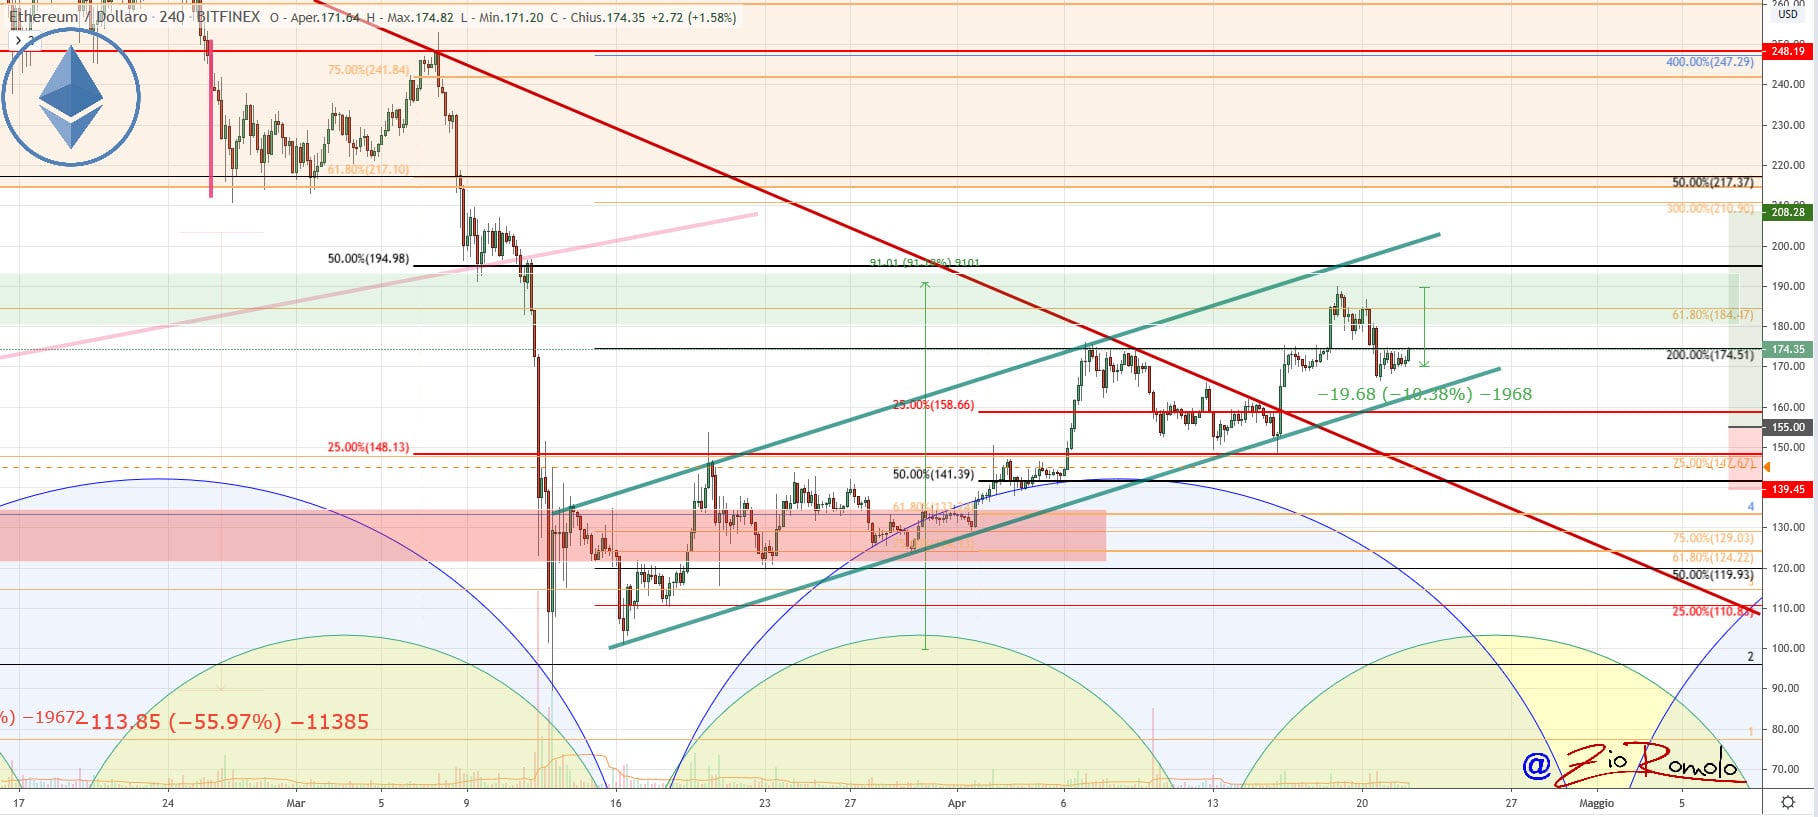
Ethereum remains within the bullish channel that started with the lows of March 16th and that so far draws higher lows and highs in a monthly context.
Ethereum today tries to recover the $175 threshold, former resistance area until last week. For ETH, it is necessary in the coming days to consider closing the monthly cycle around $155-160.
In case this level of support for ETH is held, it will be a positive and upward signal. A possible breakage will have to hold the breakage of the next support identified in the $145 area.
Below this level, the current bullish structure present since mid-March would begin to give a bearish signal of the possibility of a new trend change in the medium term.


