


The stochastic oscillator is a technical indicator designed by analyst George Lane it’s widely used in the world of trading.
It is based on the calculation of the ratio between the closing prices of the candles with the maximum or minimum prices in the period considered.
The oscillator has four fundamental elements:
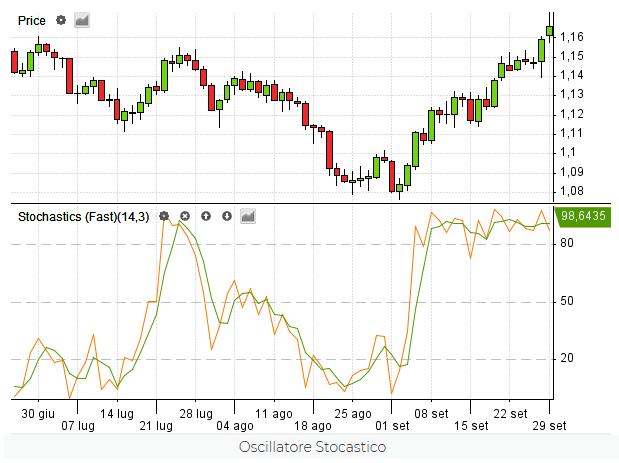
- %K: represents a line that is obtained by relating the closing price with a certain price range in the chosen period. In the basic version the period is 14;
- %D: defined as the line representing the simple moving average of %K. In this case, the basic version of the period of this SMA is 3;
- Levelling or slowing down is nothing more than a technical parameter useful for calculating the oscillator, which must always be set to 3;
- Two horizontal axes, one with a value of 80 and one with a value of 20 that delimit the overbought and oversold areas.
The intuition of Lane is based on the fact that within a bullish trend the closing prices are normally close to the maximum prices. On the contrary, in a bearish trend, the closing prices are usually close to the minimum prices.
The stochastic oscillator is divided into 3
There are three versions of oscillator:
- The fast stochastic is Lane’s original formula in which the %K line is obtained by percentage relating the closing price and a certain price range (14-period), while the %D line is simply the moving average (normally 3-period) of the %K line. However, this version is considered to be too reactive and therefore inapplicable;
- The slow stochastic was created to overcome the problems of the fast stochastic. In this version of stochastic, the %K line is built as the moving average (3-period) of the %D line of the fast stochastic version, while the %D line represents the moving average (3-period) of the new %K line;
- The full stochastic is a customizable variant of the slow stochastic in which we can set all the necessary parameters, the number of periods to be taken into account, the number of periods for %K and the number of periods of %D.This latest version is the one most used by most traders.
The stochastic oscillator “oscillates” between 0 and 100 values.
We are oversold when we have values below 20 (when you should buy an asset) and overbought when we have values above 80 (good time to sell).
If prices are in overbought or oversold areas we do not necessarily have to expect an instant trend reversal. The value may remain in overbought or oversold areas for a long time before a trend reversal occurs.