

Summary
Bitcoin prices
Bitcoin tested the bottom of its current range again and dipped beneath $31k on Saturday. While it didn’t go all of the way to the bottom of the range it did test $30k which has been a major battleground over the past week between bulls and bears.
BTC rallied more than 5% on Sunday morning and was still hanging out over 5% going into the final 4hr candle to close the week.
BTC had a daily / weekly candle close of $34,705 and is now back in the middle of the range.
Where is bitcoin’s price going next?
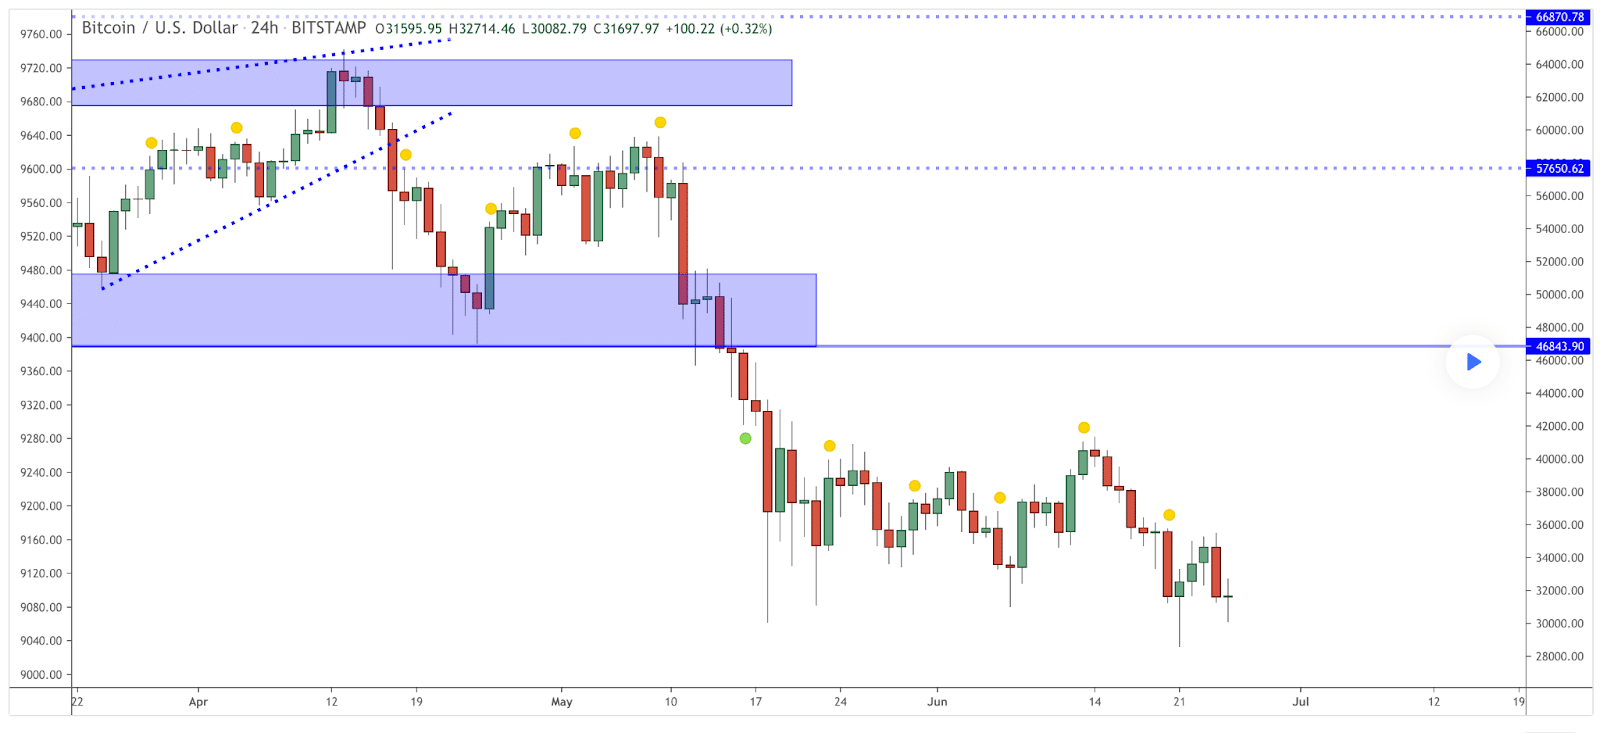
The above chart from MarcPMarkets, really illuminates how long it takes for these patterns to play out and how indecisive the market is right now.
Last week’s bullish pinbar reversal after dipping below $30k is a bullish indicator that bulls are pointing to as a short-term sign of strength. Bears point to the fact that they’ve managed to push the price below $30k once and are hoping further downside is imminent.
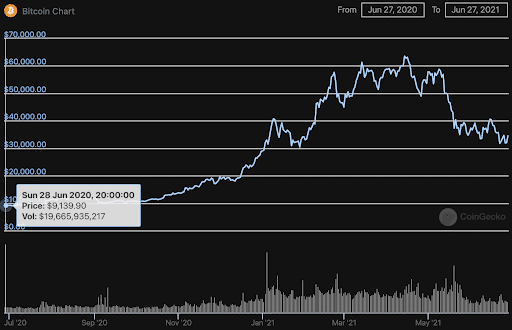
Bitcoin was similarly boring and downright unfriendly to holders this time last year. The DeFi market had already begun to boom at this point in 2020 and yet BTC was still struggling to break $10k and gain ground to the upside.
It’s important to keep in perspective that bitcoin’s value has decreased by 57.4% since it’s all-time high on April 14th and yet is still +$25,400 [+283%] for the last 12 months at the time of writing.
Ethereum Analysis
Ethereum put up a valiant effort for weeks and held up against BTC on the charts but has been decimated like the rest of the alt coin market for the better part of a month now.
Ether is -27.18% for the last 30 days at the time of writing and -20.24% for the last 30 days against BTC. ETH’s super strong start to 2021 and Q2 still has it up against BTC by 75.42% for this quarter.
Ether has been the hottest performer over the last 12 months of assets in the Top 10 and has led the market in many ways over the last few years – ETH is +705% for the last 12 months.
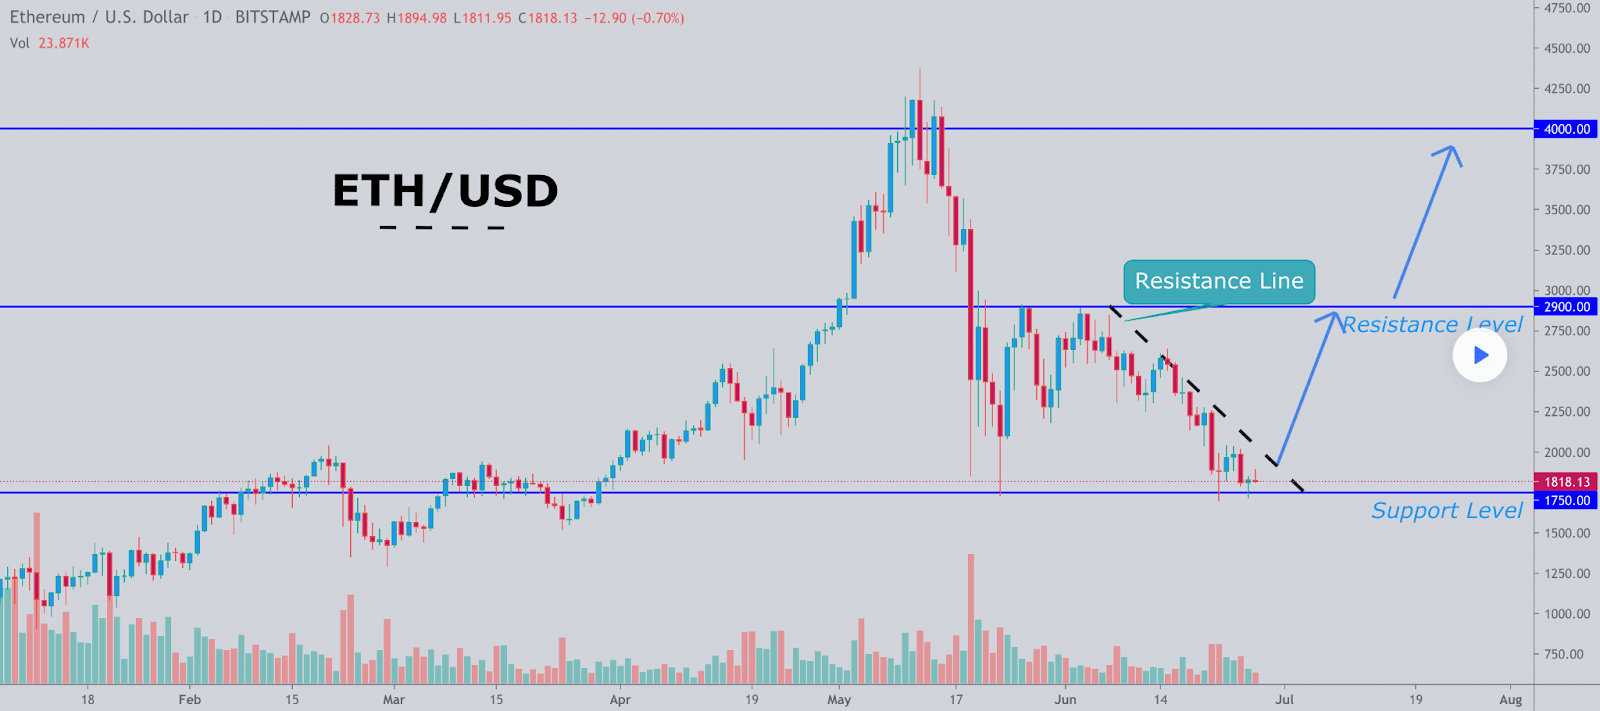
The above chart from YMGroup shows the likelihood that ETH found support and it could again test the upper bound of the short-term price trend – the likelihood of this increases dramatically with a stable BTC price or BTC price trending upward.
Ether is currently hanging out near the bottom of the trend’s Support Level as indicated in the chart above. The chart reflects strong support resistance at $1,750. The top of the range and local overhead resistance are charted at $2,900.
Ether had a daily / weekly candle close on Sunday of $1,979.
The aggregate crypto market closed the daily / weekly candle at $1.41 trillion.