


Summary
Bitcoin Analysis
The below chart from VincePrince provides an analysis on Bitcoin with bullish and bearish scenario with BTC’s 2D chart as the data.
The bearish scenario at this level for BTC is scenario A which sees BTC’s price increase to the $49,030-$49,3k level before being rejected and again retesting the bottom of its current ascending channel.
The bullish scenario which is scenario B is one where BTC climbs back to the top of the channel and either breaks its demand line to a new ATH or fails and re-tests the middle of its range.
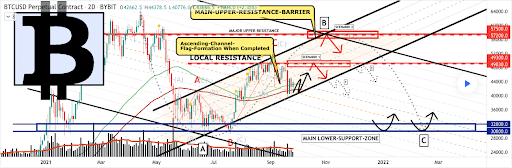
Overall, bitcoin bulls may still feel relatively in control of bitcoin’s price action above $40k. Below that level however bears will be in possession of the ball because real technical damage will have occurred.
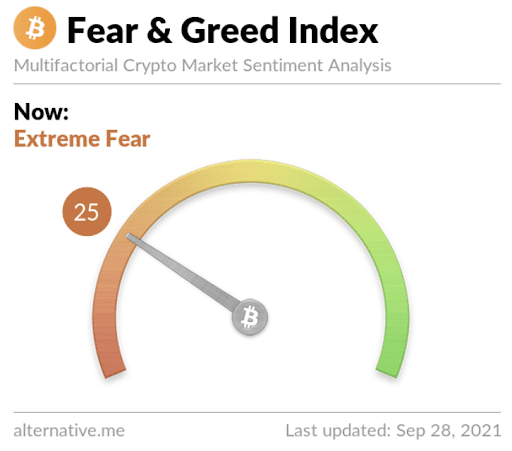
The Fear and Greed Index is 25 and in the Fear Zone, it’s -1 from yesterday’s reading of 26 that was also in the Fear Zone.
BTC’s 24 hour price range is $42,082-$44,388 and the 7 day price range is $40,554-$45,167. Bitcoin’s 52 week price range is $10,476-$64,804.
Bitcoin’s 30 day average price is $46,432.
BTC [-2.29%] closed Monday’s daily candle worth $42,191 and in red digits.
Ethereum Analysis
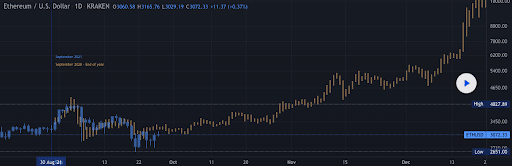
The Ethereum chart below is an overlay of September 2020 to the beginning of 2021. Traders can see ETH’s price action is very much replicating last year’s price action. Ether bulls will hope this trend continues for the rest of 2021 – if it does ETH’s price could reach 5 figures according to d0ggerel’s chart.
The second ETH chart traders should look at is the ETH’s 4hr chart and the below interpretation from Tilen_tradershub shows Ether in a descending channel. The chartist posits ETH is waiting for a breakout to the upside with confluence on the RSI.
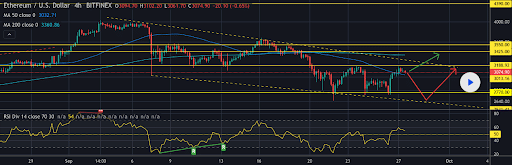
The level for ETH bulls to shatter to the upside is $3,188, if that happens the next real overhead resistance is at $3,550.
Bears on the other hand will be looking to send the price back to the bottom of ETH’s channel and push Ether’s price beneath $2,6k.
ETH’s 24 hour price range is $2,917-$3,168 and the 7 day price range is $2,742-$3,178. Ether’s 52 week price range is $337-$4,352.
Ether’s average price for the last 30 days is $3,358.
ETH [-4.48%] closed its daily candle on Monday worth $2,926 and in red figures.
Solana Analysis
Solana’s price retested an important breakout of $140 and a descending triangle on the 4hr timescale.
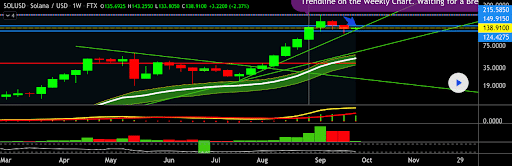
The most important chart for Solana bulls is the one below however from SGS0123 that shows how strongly Solana’s performing on the weekly timescale since mid-July.
Sunday’s weekly candle close held SOL’s trendline on the weekly timescale at $140 – so, no technical damage has even occurred on the weekly chart despite the price being -32.7% from its ATH of $213.47, at the time of writing.
SOL’s 24 hour price range is $135.75-$147.95 and the 7 day price range is $122.25-$151.4. Solana’s 52 week price range is $1.03-$215.19.
Solana [+0.45%] closed Monday’s daily candle worth $136.36 and in green digits.