Summary
Bitcoin Analysis
Bitcoin’s price topped out at local overhead resistance on Wednesday and sellers reversed course back to the downside quite violently. When Tuesday concluded BTC’s price was -$1,960.
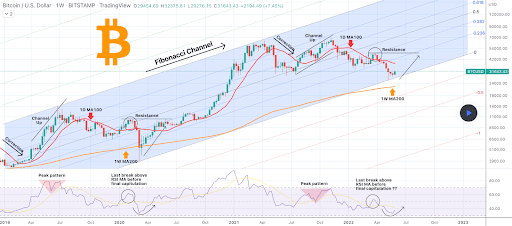
The first chart we’re looking at today is the BTC/USD 1W chart from TradingShot. Traders can see that BTC’s price is still testing a long term trend line on the weekly timescale dating back to 2019.
The chartist notes that historically BTC’s price has come back to touch the 1W MA200 before signaling a bottom price for a bear market.
The aggregate crypto market cap also couldn’t break the $1.29t level and sold-off to lower prices. The aggregate crypto market cap is at the bottom of its range on the daily timescale near $1.2t, at the time of writing.

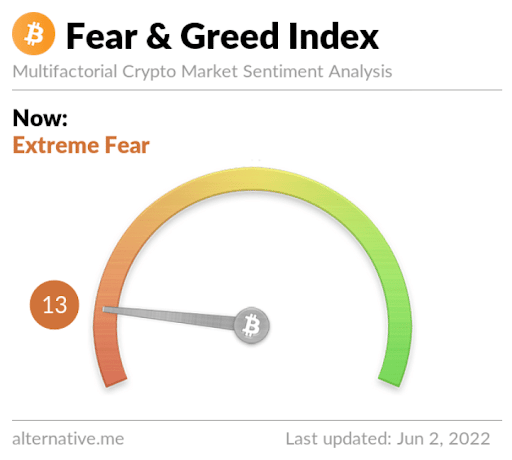
The Fear and Greed Index is 13 Extreme Fear and is -4 from Wednesday’s reading of 17.

The Fear and Greed Index is 13 Extreme Fear
Bitcoin’s Moving Averages: 5-Day [$30,590.54], 20-Day [$30,563.60], 50-Day [$37,459.56], 100-Day [$38,941.72], 200-Day [$45,688.40], Year to Date [$39,389.76].
BTC’s 24 hour price range is $29,441-$31,981 and its 7 day price range is $28,448-$32,206. Bitcoin’s 52 week price range is $26,600-$69,044.
The price of Bitcoin on this date last year was $37,590.
The average price of BTC for the last 30 days is $31,714.20 and BTC’s -15.8% over the same duration.
Bitcoin’s price [-6.17%] closed its daily candle worth $29,832 and in red figures for the first time in five days.
Ethereum Analysis
Ether’s price also swiftly reversed course on Wednesday and concluded its daily session -$124.13.
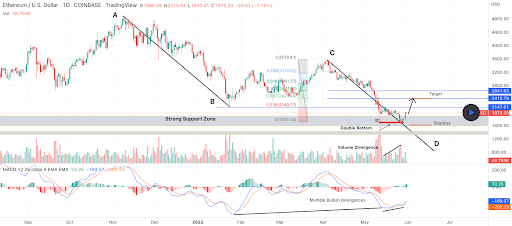
The second chart we’re analyzing for Thursday is the ETH/USD 1D chart below by ansfar. ETH’s price is trading between 0 [$1,709.34] and 0.236 [$2,149.27], at the time of writing.
The overhead targets for bullish Ether traders are 0.236, 0.382 [$2,421.44] and 0.5 [$2,650.79].
The primary target to the downside is a full retracement to the 0 fib level with a secondary target of the $1,400-$1,500 level.

ETH’s 24 hour price range is $1,774-$1,967 and its 7 day price range is $1,724-$1,996. Ether’s 52 week price range is $1,707-$4,878.
The price of ETH on this date in 2021 was $2,706.19.
The average price of ETH for the last 30 days is $2,179.63 and ETH’s -28.52% over the same timespan. BTC dominance also continues to rise against ETH and alt coins in general.
Ether’s price [-6.39%] closed its daily candle on Wednesday worth $1,817.65 and in red digits for a second consecutive day.
Chainlink Analysis
Chainlink’s price traded lower as well on Wednesday during its daily session and LINK’s price finished its day -$0.66.
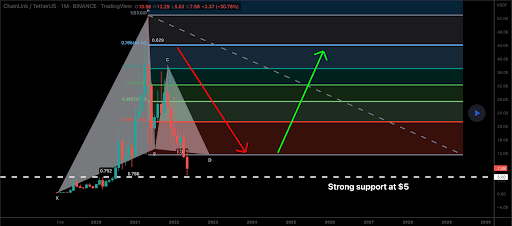
The third chart we’re analyzing today is the LINK/USD 1M chart below from moon333. LINK’s price is trading between 0 [$1.59] and 0.236 [$11.36], at the time of writing.
The targets for bullish traders are 0.236, 0.382 [$27.41], and 0.5 [$32.29].
Conversely, bearish LINK traders are looking to snap the 0 fib level and send LINK’s price to a multi-year low.

Chainlink’s 24 hour price range is $6.8-$7.74 and its 7 day price range is $6.27-$7.74. Chainlink’s 52 week price range is $5.56-$38.17.
Chainklink’s price on this date last year was $30.66.
The average price of LINK over the last 30 days is $8.14 and LINK’s price is -31.08% over the same time frame.
Chainlink’s price [-8.71%] closed its daily session on Wednesday worth $6.92 and back in red figures after a streak of four green candle closes prior.


