

Given the recent movement of Bitcoin (BTC), which could be described as sideways, in this article we will look at the possibility of using a strategy that has rarely been applied to this market: the false breakout.
Summary
What is a false breakout?
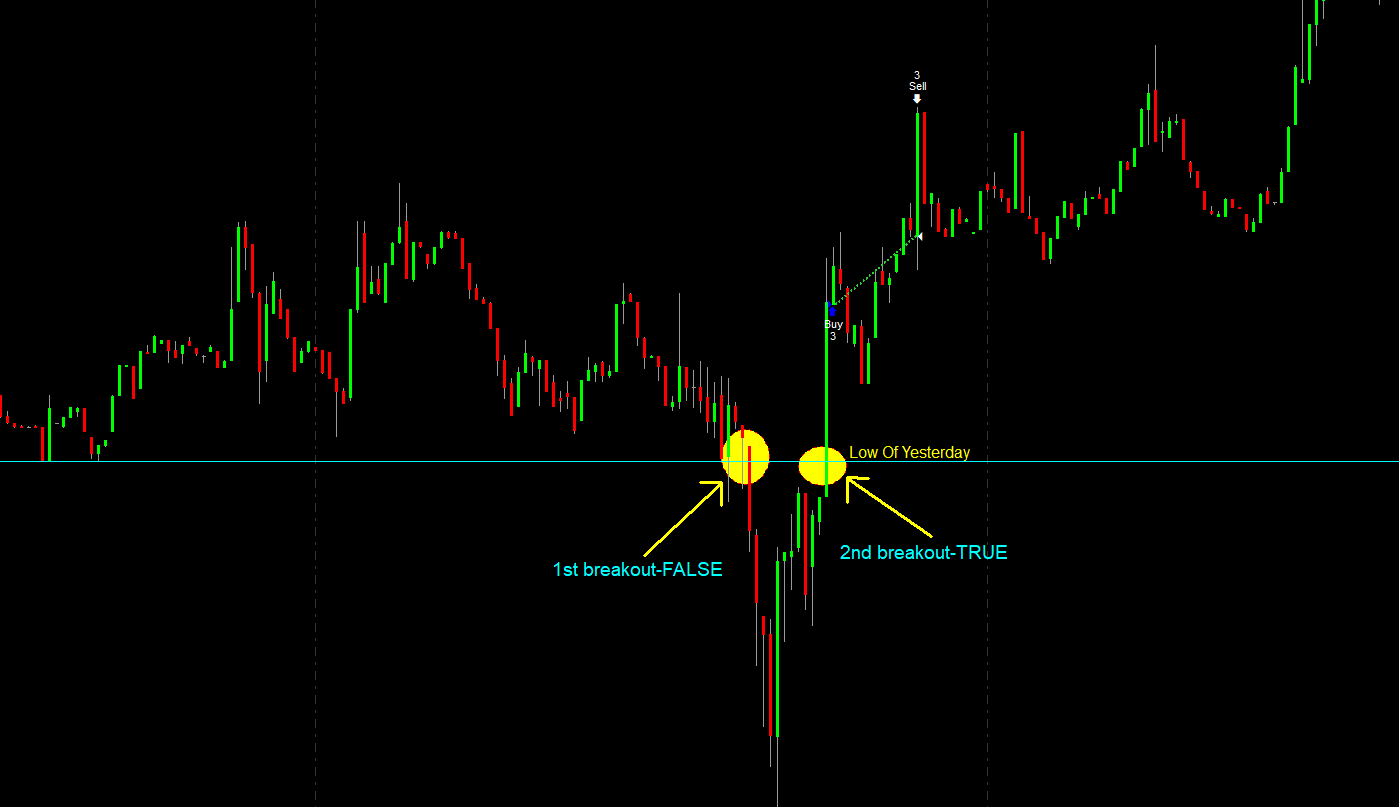
A false breakout is a situation in which a breakout occurs at a sensitive level, such as the previous session’s high, and then the market decides to reverse course and retrace its steps, forming another breakout, but from the opposite side.
An example of this pattern is shown in Figure 1. This type of strategy should tend to work at times when the market is not particularly buoyant and there is no clear trend. A bit like 2023, which started with a lot of momentum and directionality, but became less volatile and expansive from mid-September.
Rules of a hypothetical trading system based on the false breakout in Bitcoin (BTC)
The strategy you are going to use will wait for a false breakout at the low of the previous session (a bar close below the low) and the moment a breakout occurs at the low of the previous session (a bar close above the low), the system will have all the conditions to enter a buy position.
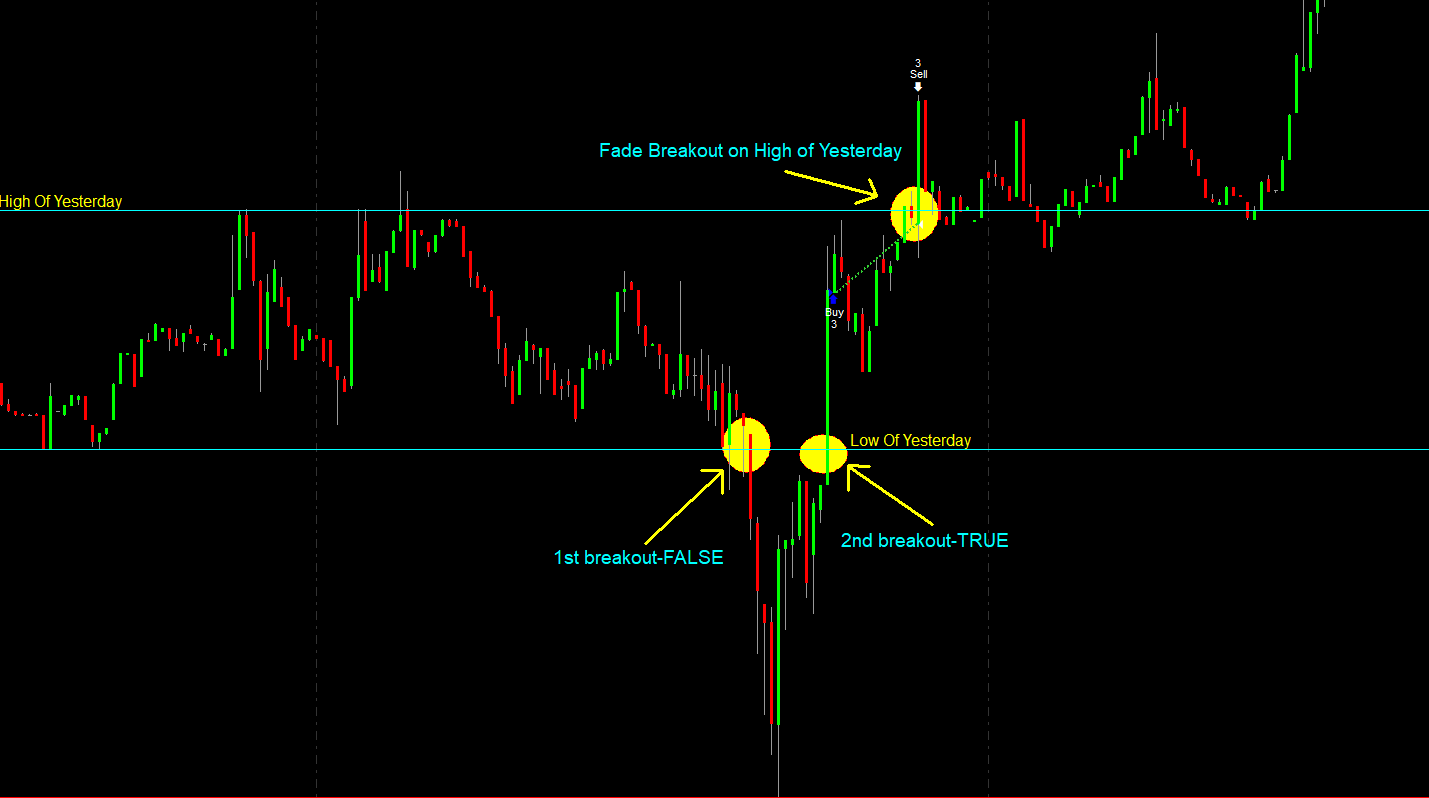
The trade is closed on another false breakout, this time on the previous session’s high (Figure 2).
This basic logic could be applied over several time frames and, of course, as the time frame changes, the number of signals the strategy could provide will also change.
To give a practical example, it will be much easier to observe false breakouts on fast time frames, such as 5 or 15 minutes, than on an hourly time frame. In order to be verified, a false breakout must wait for a bar to close above or below the entry level being considered. Therefore, as the bar width increases, the total number of trades made by the system will decrease.
Performance report of a trading system based on the false breakout in BitCoin (BTC)
The following figures show that with a fixed size of $100,000 per trade, the best results are obtained on a 15 or 60 minute time frame. Nevertheless, all four simulations (5M, 15M, 30M and 60M) show positive results with increasing equity lines (Figures 3-4-5-6).
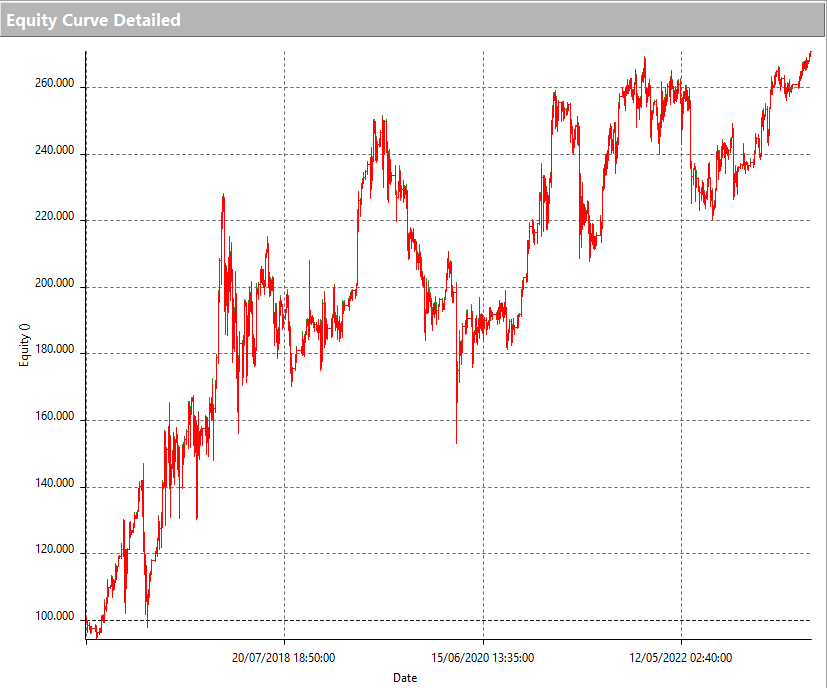
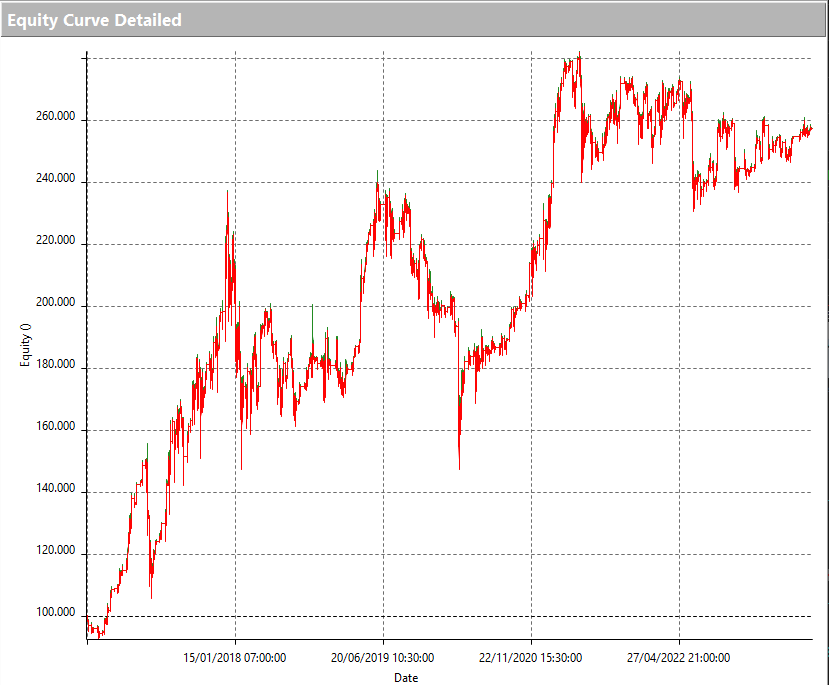
The biggest profit is made with the strategy developed on the 60-minute time frame. In this case, the signals provided by the system are lower and positions are held open for longer than on the narrower time frames, which inevitably increases the average trade and the overall profit achieved by the strategy.
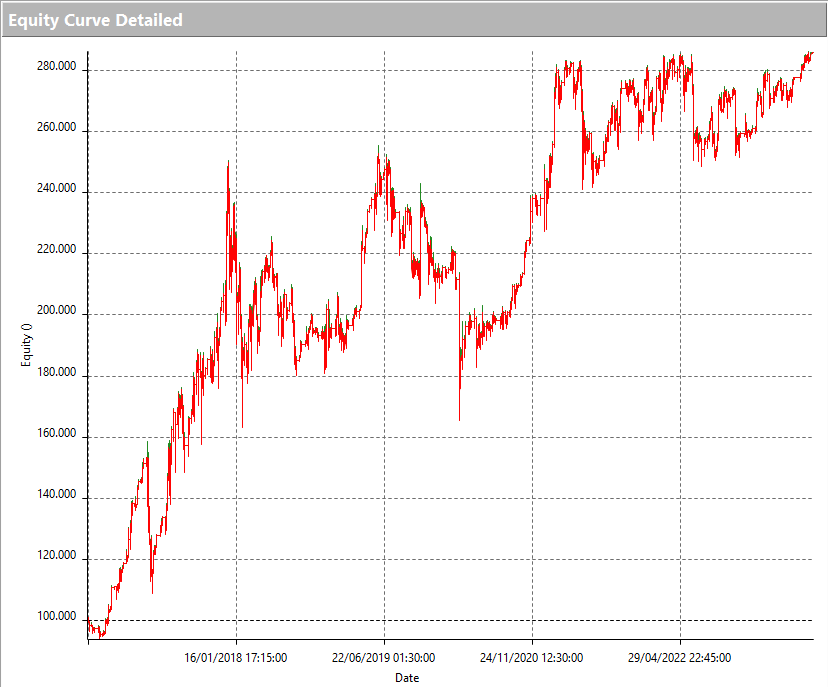
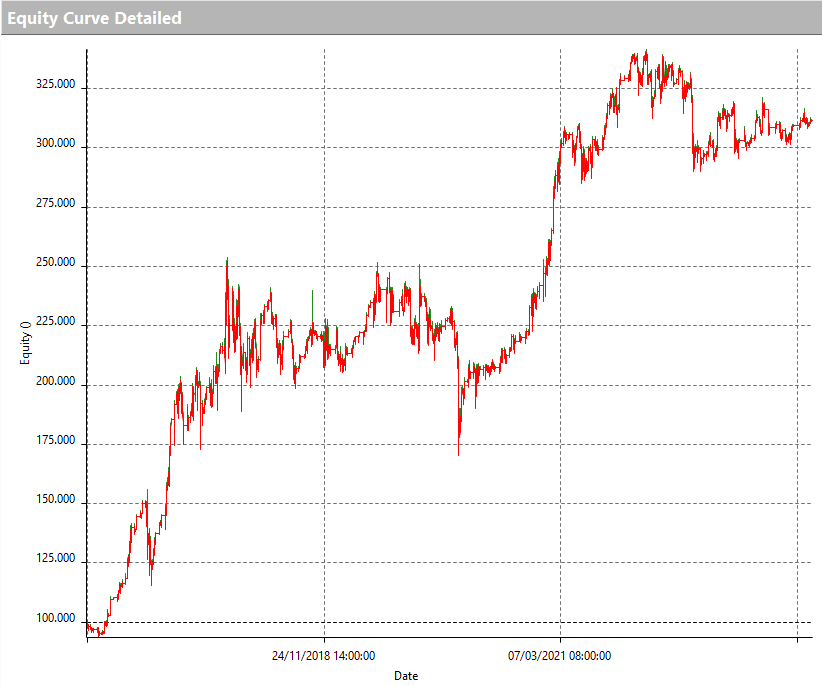
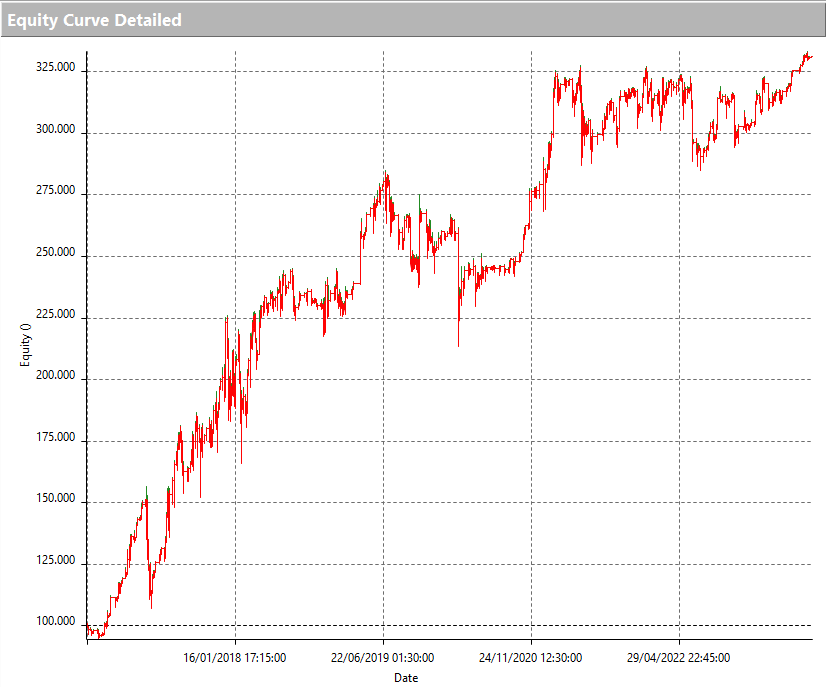
Nevertheless, it is decided to continue developing the 15-minute strategy, which offers a better compromise between the total number of trades and their duration (Figures 7 and 8).
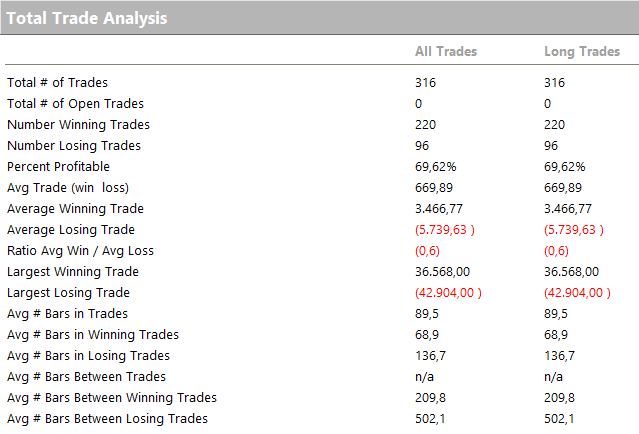
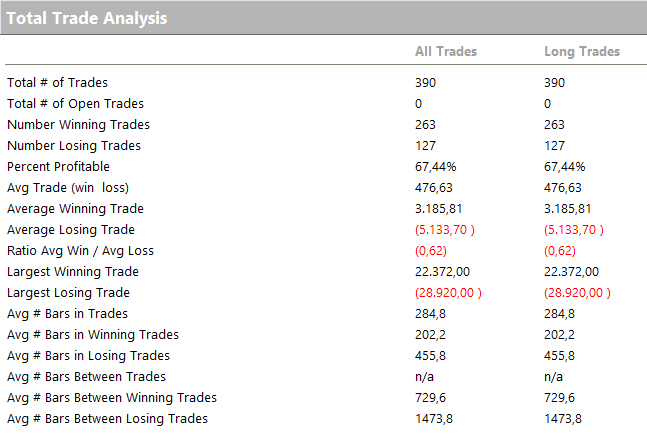
The average trade of the 15 minute strategy is good and amounts to $476 or 0.47% of the value of an average trade.
However, the stock line is still quite erratic and very volatile, although it has increased over the years since 2016.
Optimising a trading system based on false breakouts in BitCoin (BTC)
In an attempt to improve the shape of the profit curve, a condition is introduced that looks for false breakouts only in certain well-defined situations. With the help of a proprietary pattern list, it turns out that this type of trade is most appropriate after witnessing 5 days (a trading week) in which the market has taken a clear and decisive direction. For example, if you group together the daily bars of the last 5 days and the body (i.e. the absolute value of the difference between the open of 5 days ago and the close of the previous day) is at least 0.5% higher than the total range of the last 5 days (high of 5 days ago subtracted from low of yesterday), then the strategy will try to make false breakouts.
Operational reversals after a well defined short term trend can be the way to go, as we are more likely to see rebounds after a trend and conviction phase.
In the following figures (9 and 10) we can see how the pattern improves the shape of the equity line and increases the average trade.
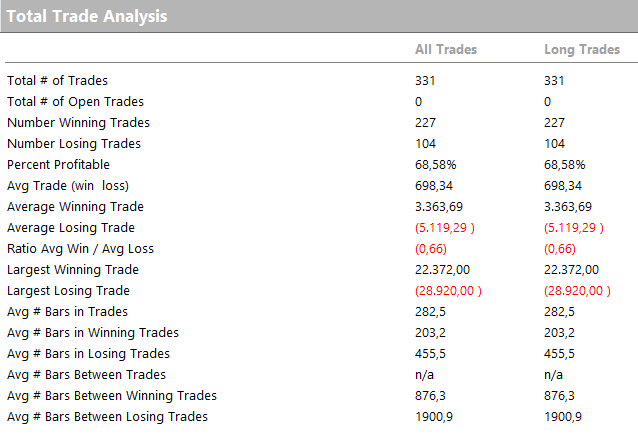
The total profit also increases compared to the situation without a pattern, so entering a reversal only after witnessing a strong trend in the last 5 days is certainly more convenient than making all the false breakouts one might witness in the market.
Adding a stop loss to the trading system based on the false breakout in BitCoin (BTC)
At this point, all that remains to be done is to add a stop loss to this strategy which, although it already has a type of trade exit (false breakout on the previous session’s high), lacks a standard exit in the event of a large loss.
Figure 11 shows how the results vary as the stop loss varies from 0, a situation with no stop loss, to $5,000, i.e. a deviation of 5% in relation to the notional amount used.
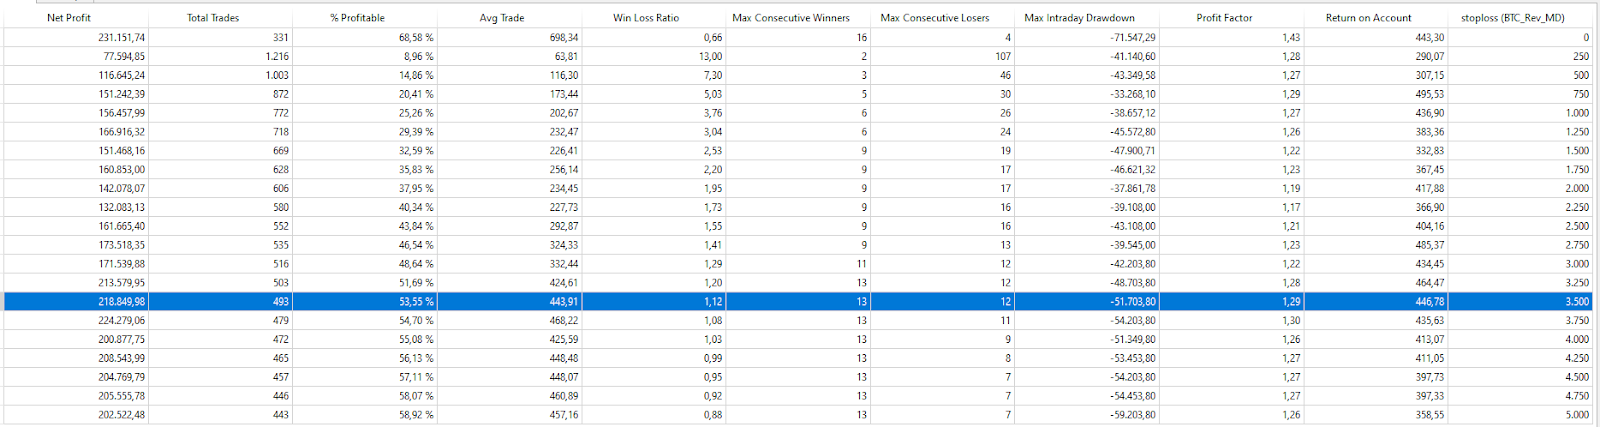
Obviously, the solution without stop loss is better in terms of net profit. However, the evaluation of the drawdown of the system is different. In fact, in all the situations where a stop loss is identified, the drawdown is lower than in the situation where no stop loss is identified.
Among the best results is the range between $3,000 and $5,000. Usually in reversal strategies it is normal to find stop loss values that could be described as ‘wide’. However, it can be wider than normal because when you enter a reversal you are not sure of the exact point at which the trend reversal will occur.
We therefore choose $3,500 as a reasonable value for this market as it keeps the total profit almost the same, reduces the drawdown by a good 30% and the average trade is large enough for live trading.
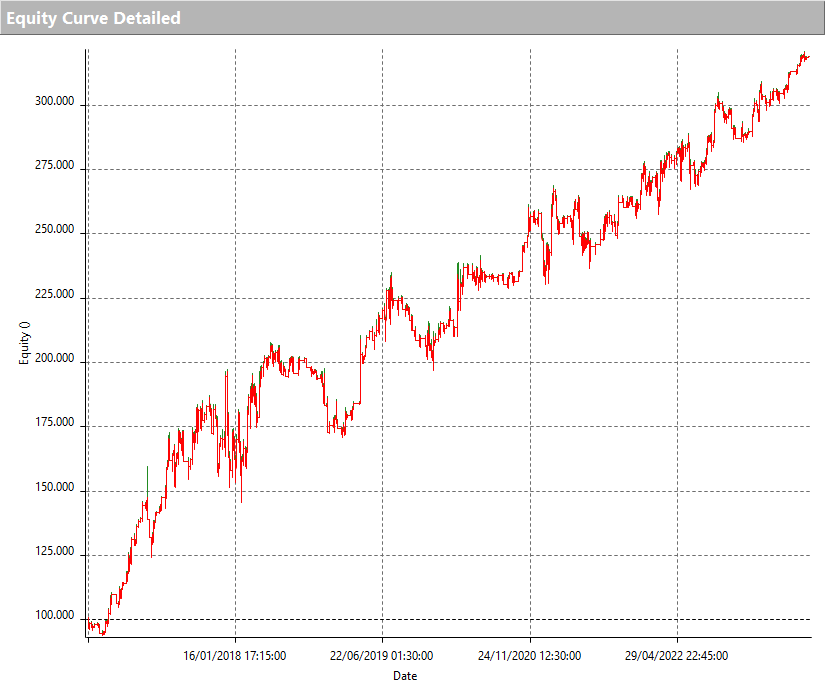
Figure 12 shows the profit curve after adding the stop loss. As seen in the previous optimisation, the stop loss reduces the drawdown and decreases the volatility of the profit curve.
Trading system conclusions based on the false breakout in BitCoin (BTC)
Bitcoin is proving to be a constantly evolving market. In fact, this article has seen a reversal strategy work well even in a notoriously trend-following market.
This aspect signifies flexibility and the ability to adapt to different market phases that all traders will inevitably face. Therefore, having different types of strategies that can potentially be used in this market makes the market itself increasingly attractive, even for automated trading.
Until next time and happy trading!
Andrea Unger