


Summary
Summary
UNI is changing hands around 6.1 USDT, below all its key daily moving averages, which confirms a broadly bearish regime on the higher timeframe. Momentum is negative but not capitulatory, with the daily RSI hovering in the low 40s, suggesting cautious selling rather than panic. Moreover, the MACD remains below its signal line, indicating that bulls have not yet regained control of medium-term direction. Volatility on the daily chart is moderate, while intraday readings show a tighter range, pointing to a phase of consolidation after recent losses. At the same time, liquidity across the crypto market remains strong, but risk appetite is muted as traders prioritize capital preservation. Overall, UNI sits in a corrective environment where any bounce still needs strong confirmation before being treated as a lasting trend change.
Uniswap crypto news: Market Context and Direction
The broader crypto backdrop is mixed, with total market capitalization hovering near 3.08 trillion dollars, down slightly over the last 24 hours. That said, Bitcoin dominance above 56% shows that capital is clustering in the largest asset, a typical pattern during uneasy phases for altcoins. This dynamic usually leaves tokens like UNI more vulnerable to pullbacks and slower to recover when the market wobbles.
Sentiment data reinforces this defensive stance. The Fear & Greed Index sits at 15, classified as Extreme Fear, which signals that investors are risk averse and quick to reduce exposure on rallies. Moreover, when fear is this elevated, even technically attractive setups can take longer to play out, as fresh capital waits on the sidelines. For UNI, this means that upside attempts may initially encounter a wall of supply from short-term traders eager to exit breakeven positions.
Technical Outlook: reading the overall setup
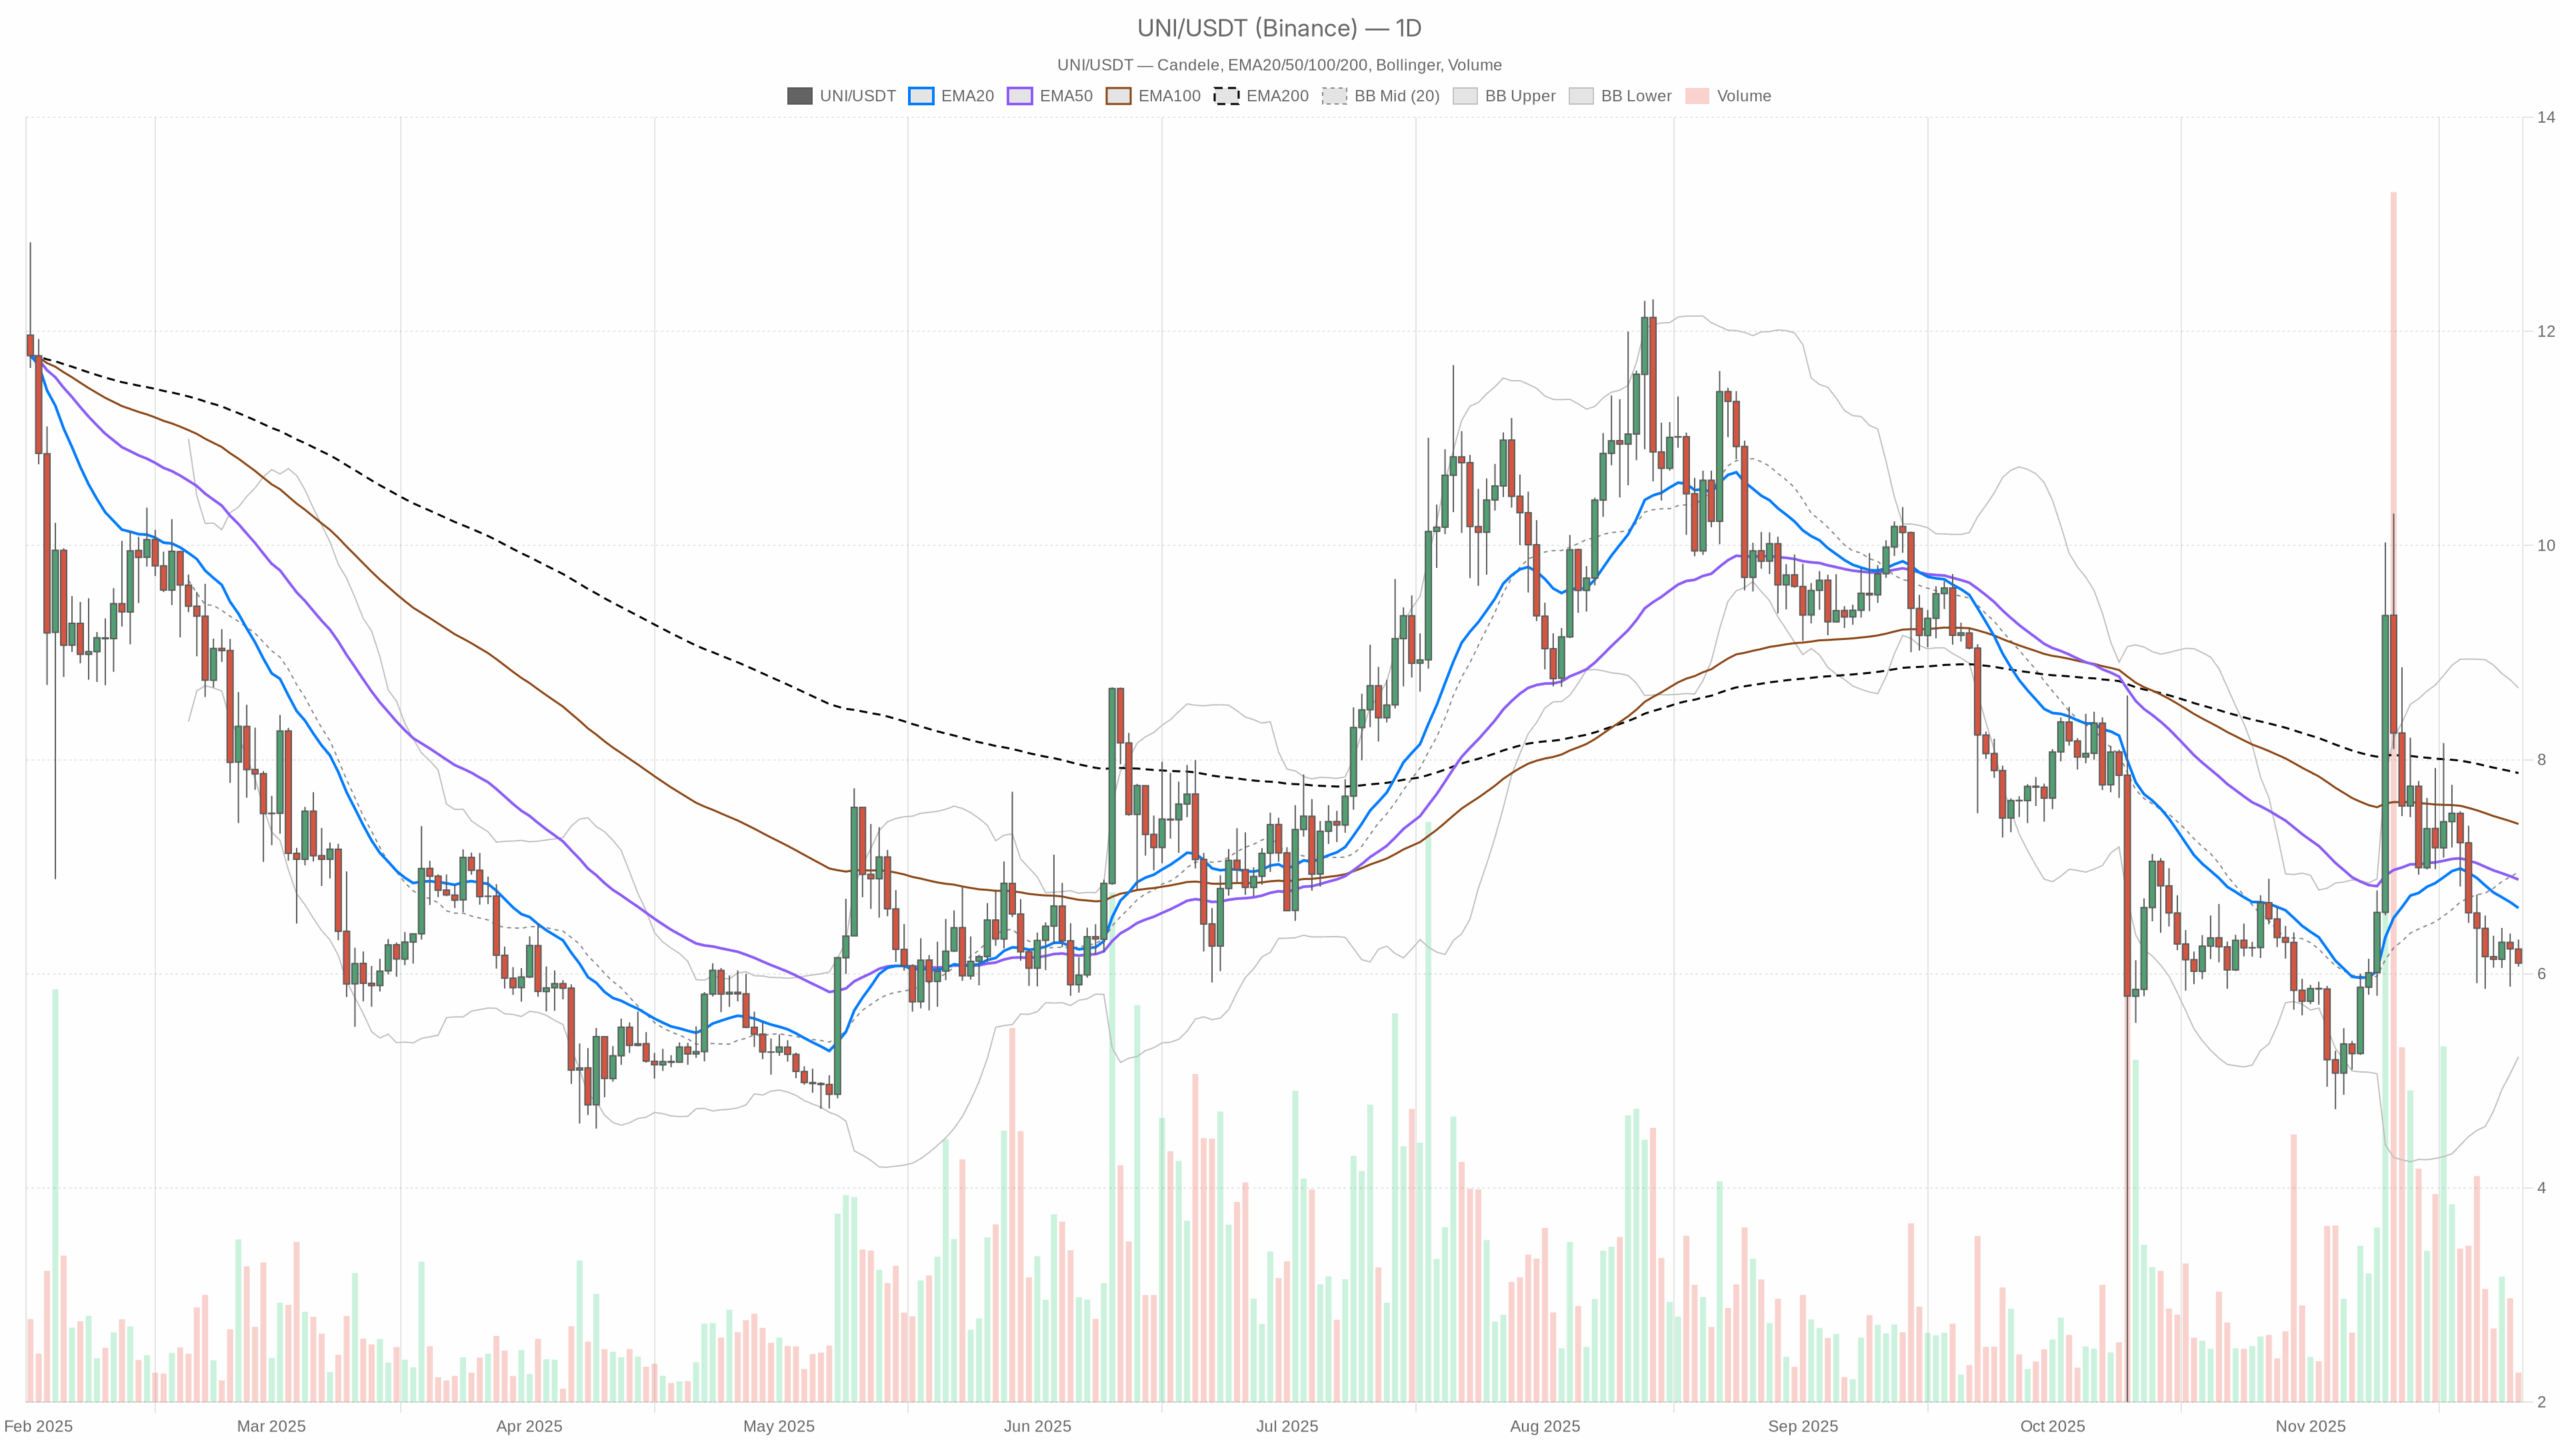
On the daily timeframe, UNI trades around 6.1 USDT, clearly below the 20-day EMA at 6.62, the 50-day EMA at 6.88 and the 200-day EMA at 7.88. This alignment of moving averages above spot price is typical of a mature downtrend, where rallies are often sold into rather than extended. Until price can reclaim at least the 20-day EMA, any bounce is better viewed as a counter-trend move.
The daily RSI at 43.48 confirms this picture. It is below the neutral 50 mark but far from oversold territory, suggesting persistent but controlled selling pressure. In other words, bears remain in charge, yet there is still room for the oscillator to rotate higher without invalidating the broader corrective structure.
The MACD line sits at -0.11, under its signal line at 0.02, with a negative histogram of -0.13. This configuration indicates that downside momentum has not fully exhausted, even if the pace of decline is not accelerating dramatically. A future bullish crossover of the MACD above its signal would be one of the first signs that the market is attempting to shift back into accumulation.
Bollinger Bands on the daily chart show a midline at 6.95, with the upper band near 8.67 and the lower band around 5.23. Price currently trades in the lower half of this envelope, reflecting a bias toward the downside within a still-broad volatility channel. However, the absence of a touch or break of the lower band hints that selling is firm but not yet climactic.
The ATR(14) on the daily timeframe comes in at 0.67, pointing to moderate daily swings relative to price. This kind of volatility profile often corresponds to a controlled correction rather than a disorderly flush, leaving room for both gradual continuation lower or a slow, choppy reversal.
Intraday Perspective and UNIUSDT token Momentum
Zooming into intraday charts, the hourly time frame paints a similar but more nuanced story. The H1 close around 6.11 USDT is fractionally below the 20-hour EMA at 6.16 and the 50-hour EMA at 6.19, while the 200-hour EMA at 6.52 remains far above, confirming a short-term downtrend nested inside the broader bearish structure. Meanwhile, this clustering of EMAs close to price shows the market in a consolidation pocket after recent declines.
The hourly RSI at 43.84 echoes the daily signal, favoring sellers yet not indicating exhaustion. As a result, short-term bounces can emerge, but they are more likely to be sold until momentum readings reclaim the 50–55 area consistently. The MACD on H1 is slightly negative and almost flat, suggesting waning intraday momentum and a market waiting for a fresh catalyst.
On the 15-minute chart, the picture remains cautious. Price trades close to 6.1 USDT, modestly under the 20 and 50-period EMAs and also below the 200-period EMA at 6.19. The RSI at 39.14 points to mild short-term oversupply, but without a spike that would signal capitulation. Bollinger Bands on this timeframe are fairly tight, aligning with an ATR(14) near 0.03, a combination that usually reflects compressed volatility before the next directional move.
Key Levels and Market Reactions
Daily pivot levels provide a useful roadmap for traders. The central pivot point lies near 6.16 USDT, just above current price, making this zone an immediate battleground. If buyers can push and hold above this area, attention would likely shift to the first resistance band around 6.26 USDT, where short-term sellers may look to reassert control. A decisive break and consolidation above that pocket would increase the odds of a more meaningful short squeeze toward the 20-day EMA.
On the downside, the first support region sits around 6.01 USDT. A clear loss of this floor, especially on strong volume, would signal that bears are pressing for a deeper extension toward the lower Bollinger Band region closer to 5.23. However, if price repeatedly tests but holds around 6.0, it could mark the early phase of a base, potentially preparing the ground for a medium-term reversal.
Future Scenarios and Investment Outlook
Overall, the technical landscape favors a cautious stance, with a primary bearish scenario still dominant while early signs of stabilization begin to appear on lower timeframes. Conservative participants may prefer to wait for clear evidence of trend reversal confirmation, such as a daily close back above the 20-day EMA combined with improving RSI and a bullish MACD crossover. More active traders, in contrast, might look to exploit the defined intraday range between 6.0 and 6.26, keeping tight risk controls in a market that still trades under the shadow of extreme fear. In the coming sessions, how price behaves around these pivot zones will likely determine whether this phase evolves into a prolonged grind lower or the first chapter of a recovery story for UNI.
This analysis is for informational purposes only and does not constitute financial advice.
Readers should conduct their own research before making investment decisions.