


Summary
Summary
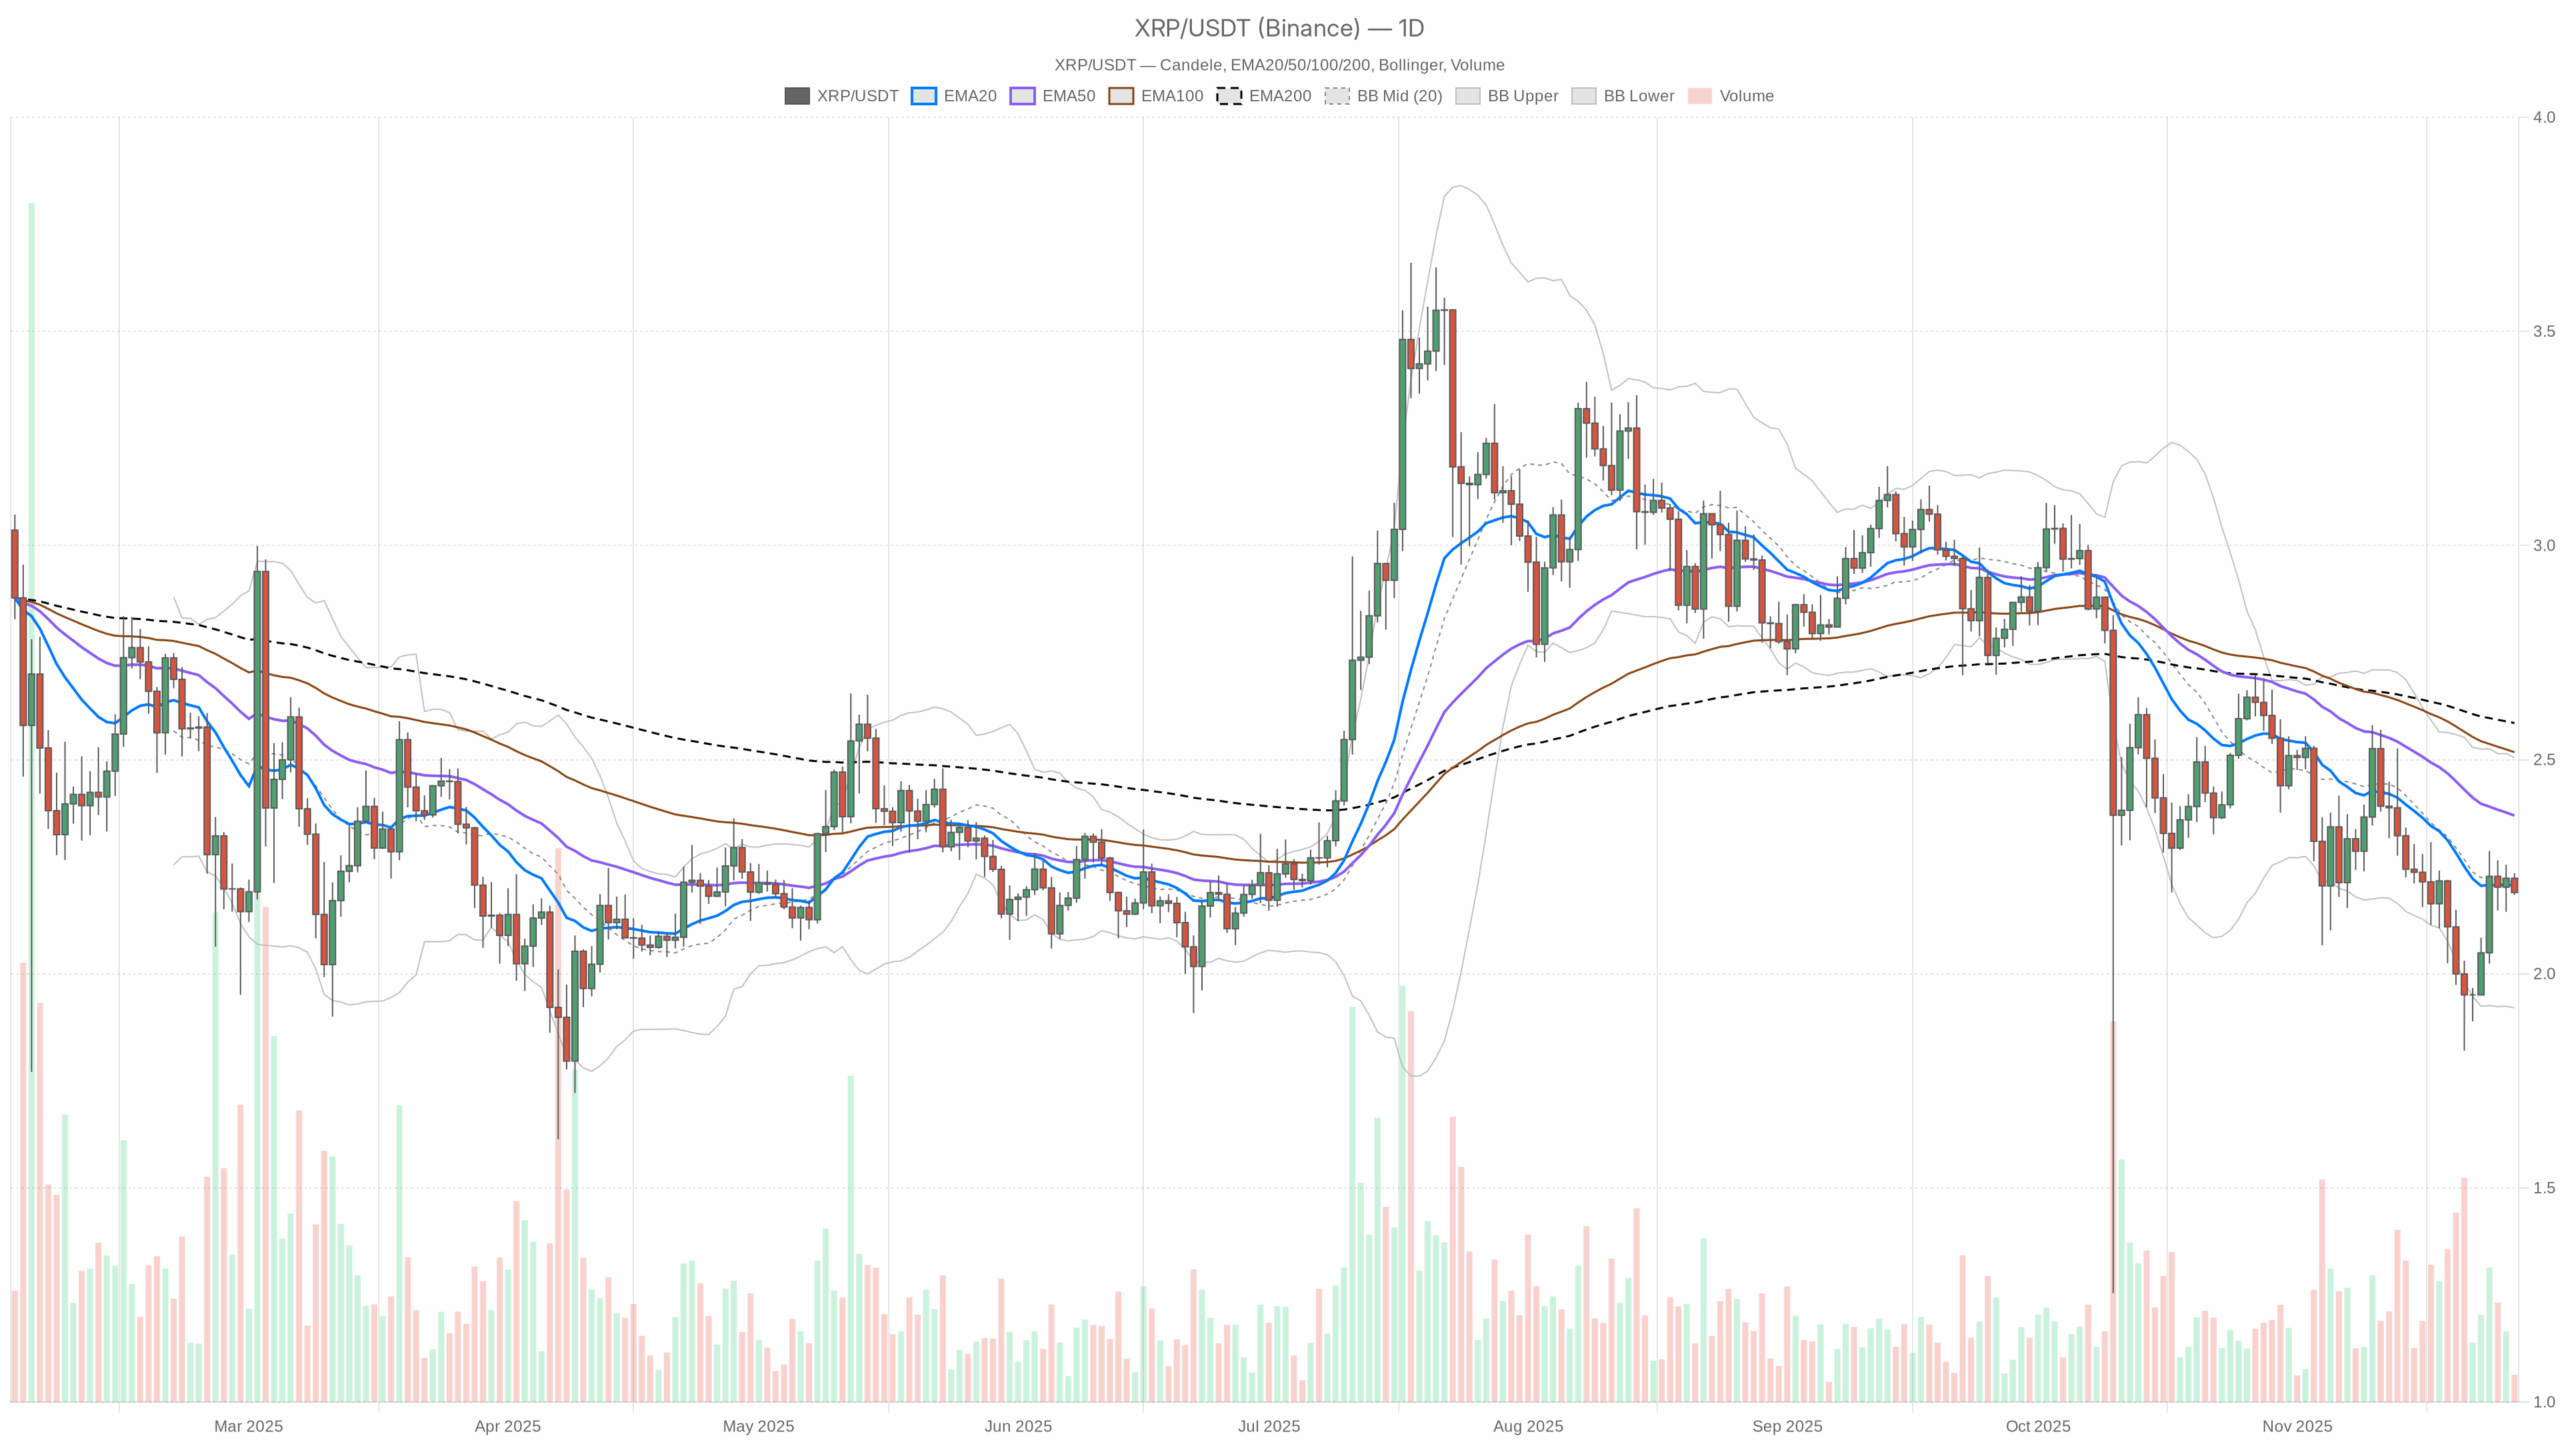
The asset trades around 2.19 USDT, slightly under its 20-day moving average, confirming a mildly defensive tone. Daily indicators paint a soft bearish regime rather than an aggressive selloff. Meanwhile, volatility remains contained, with the 14-day ATR at just 0.14, limiting abrupt swings for now. Market-wide sentiment sits in Extreme Fear at 22 on the Fear & Greed Index, signaling investors remain risk-averse despite a broader market cap recovery. Moreover, Bitcoin dominance near 57% shows capital is concentrating in the benchmark coin rather than rotating forcefully into altcoins. Overall, this backdrop suggests a market that is cautious but not capitulating, leaving room for both short squeezes and renewed downside tests.
Ripple XRP price: Market Context and Direction
On the higher time frame, the daily regime is labeled bearish, and that label matches the underlying structure. Price at 2.19 sits beneath the 50-day EMA at 2.37 and the 200-day EMA at 2.59, placing the token on the lower side of its medium- and long-term ranges. This configuration often corresponds to a downtrend in need of fresh catalysts to reverse.
Yet the broader crypto market is not in crisis mode. Total capitalization stands near 3.2 trillion dollars, up almost 3.9% over the last 24 hours. That said, Bitcoin’s dominance at roughly 57% reveals that the recovery is led mainly by BTC, while altcoins struggle to attract the same conviction. For this asset, that means rallies may be shallower or slower unless market leadership rotates.
Sentiment adds a further layer: the Fear & Greed Index shows Extreme Fear at 22. Historically, such readings can precede either extended basing phases or sharp relief rallies. However, in combination with a bearish daily regime, it more likely reflects investors de-risking and demanding a discount before committing fresh capital.
Technical Outlook: reading the overall setup
Starting with moving averages, the daily close at 2.19 is marginally below the 20-day EMA at 2.21, and more clearly under the 50-day and 200-day averages. This layered structure, with shorter EMAs below longer ones, supports the idea of trend continuation to the downside rather than an established reversal. Nevertheless, the distance to the 20-day line is tiny, suggesting bears are not in full control.
The RSI at 46.76 reinforces this nuanced view. It sits just under the neutral 50 mark, reflecting weak but not oversold momentum. Sellers have an edge, yet there is no sign of panic or exhaustion; price can drift either sideways or lower without triggering immediate contrarian signals.
MACD dynamics are equally balanced. The MACD line is at -0.07, slightly above its signal at -0.09, with a positive histogram of 0.02. This indicates a modest momentum inflection as downside pressure eases. It does not yet qualify as a robust bullish crossover, but it hints that the strongest leg of the previous decline could be behind us.
Bollinger Bands on the daily chart show the midline at 2.21, upper band at 2.51 and lower band at 1.92. Price is trading just under the midline, pointing to a consolidation phase within a broader bearish backdrop. There is still comfortable room on both sides of the range, implying that a break toward either band could define the next directional push.
The 14-day ATR at 0.14 underscores this picture of moderation. Such a reading means daily candles typically span about 6–7% of price, which is relatively subdued for this asset. As a result, any upcoming volatility expansion from these levels could act as an early warning of a new impulsive leg, up or down.
Pivot levels add further nuance. The main daily pivot sits at 2.20, almost exactly where price is trading, emphasizing an area of short-term equilibrium. The first resistance zone lies just above, around 2.22, while the first meaningful support emerges near 2.17. How the market behaves around this narrow band will likely confirm whether the current movement is mere digestion or the prelude to a stronger trend move.
Intraday Perspective and XRPUSDT token Momentum
On the hourly chart, the picture softens from bearish to neutral. Price at 2.19 is roughly aligned with the 20-hour and 50-hour EMAs near 2.20 and 2.19, while the 200-hour EMA at 2.14 sits below, acting as a broader intraday floor. This clustering points to a short-term balance of power between buyers and sellers.
Meanwhile, the hourly RSI around 43.7 shows mild downside bias but no capitulation. MACD on this timeframe is essentially flat, with line, signal and histogram near zero, confirming that intraday momentum is lacking a clear driver. As a result, short-term traders may find that breakouts need volume confirmation before becoming reliable.
On the 15-minute chart, EMAs once again converge around 2.19–2.20, and RSI slips lower to about 39.5. That combination suggests sluggish bearish intraday momentum without strong trend strength. Until either buyers lift price decisively above these clustered averages or sellers punch through nearby supports, the token is likely to remain choppy.
Key Levels and Market Reactions
In the immediate term, the 2.20 region — essentially the daily pivot and 20-day EMA area — acts as a tactical battleground. A sustained move above 2.22 would start to pressure short positions and open the way toward the upper Bollinger Band near 2.51, where stronger supply could emerge. A clean breakout there, especially accompanied by rising volume and ATR, would be a notable signal that the broader bear structure is weakening.
On the downside, the first line of defense sits near 2.17, with the lower band at 1.92 as a deeper risk zone. If price slides back toward that lower envelope while RSI remains above oversold territory, it would point to trend continuation rather than capitulation. However, a bounce from the 1.92–2.00 area, coupled with improving MACD, could sketch a medium-term base.
Future Scenarios and Investment Outlook
Overall, the prevailing scenario remains moderately bearish on the daily chart, contrasted by neutral intraday flows. If sentiment across crypto improves and capital rotates away from Bitcoin’s dominance, the token could attempt a recovery toward its 50-day and 200-day averages. Yet Extreme Fear and a still-negative MACD backdrop caution that any rally may initially be treated as a selling opportunity.
For longer-term participants, monitoring whether price can reclaim and hold above the 20-day and 50-day EMAs will be crucial for confirming a trend shift from defense to accumulation. Shorter-term traders, meanwhile, may focus on breakouts from the 2.17–2.22 band, aligning positions with the first decisive move in volatility. In this sense, the current structure offers a valuable map: risk is defined, volatility is contained, and the next expansion — whichever direction it takes — is likely to set the tone for the next chapter in the Ripple XRP price story.
This analysis is for informational purposes only and does not constitute financial advice.
Readers should conduct their own research before making investment decisions.