

The market remains in a controlled corrective phase as Bitcoin crypto prezzo grinds lower below key resistance, while sentiment shows fear without outright capitulation.
Summary
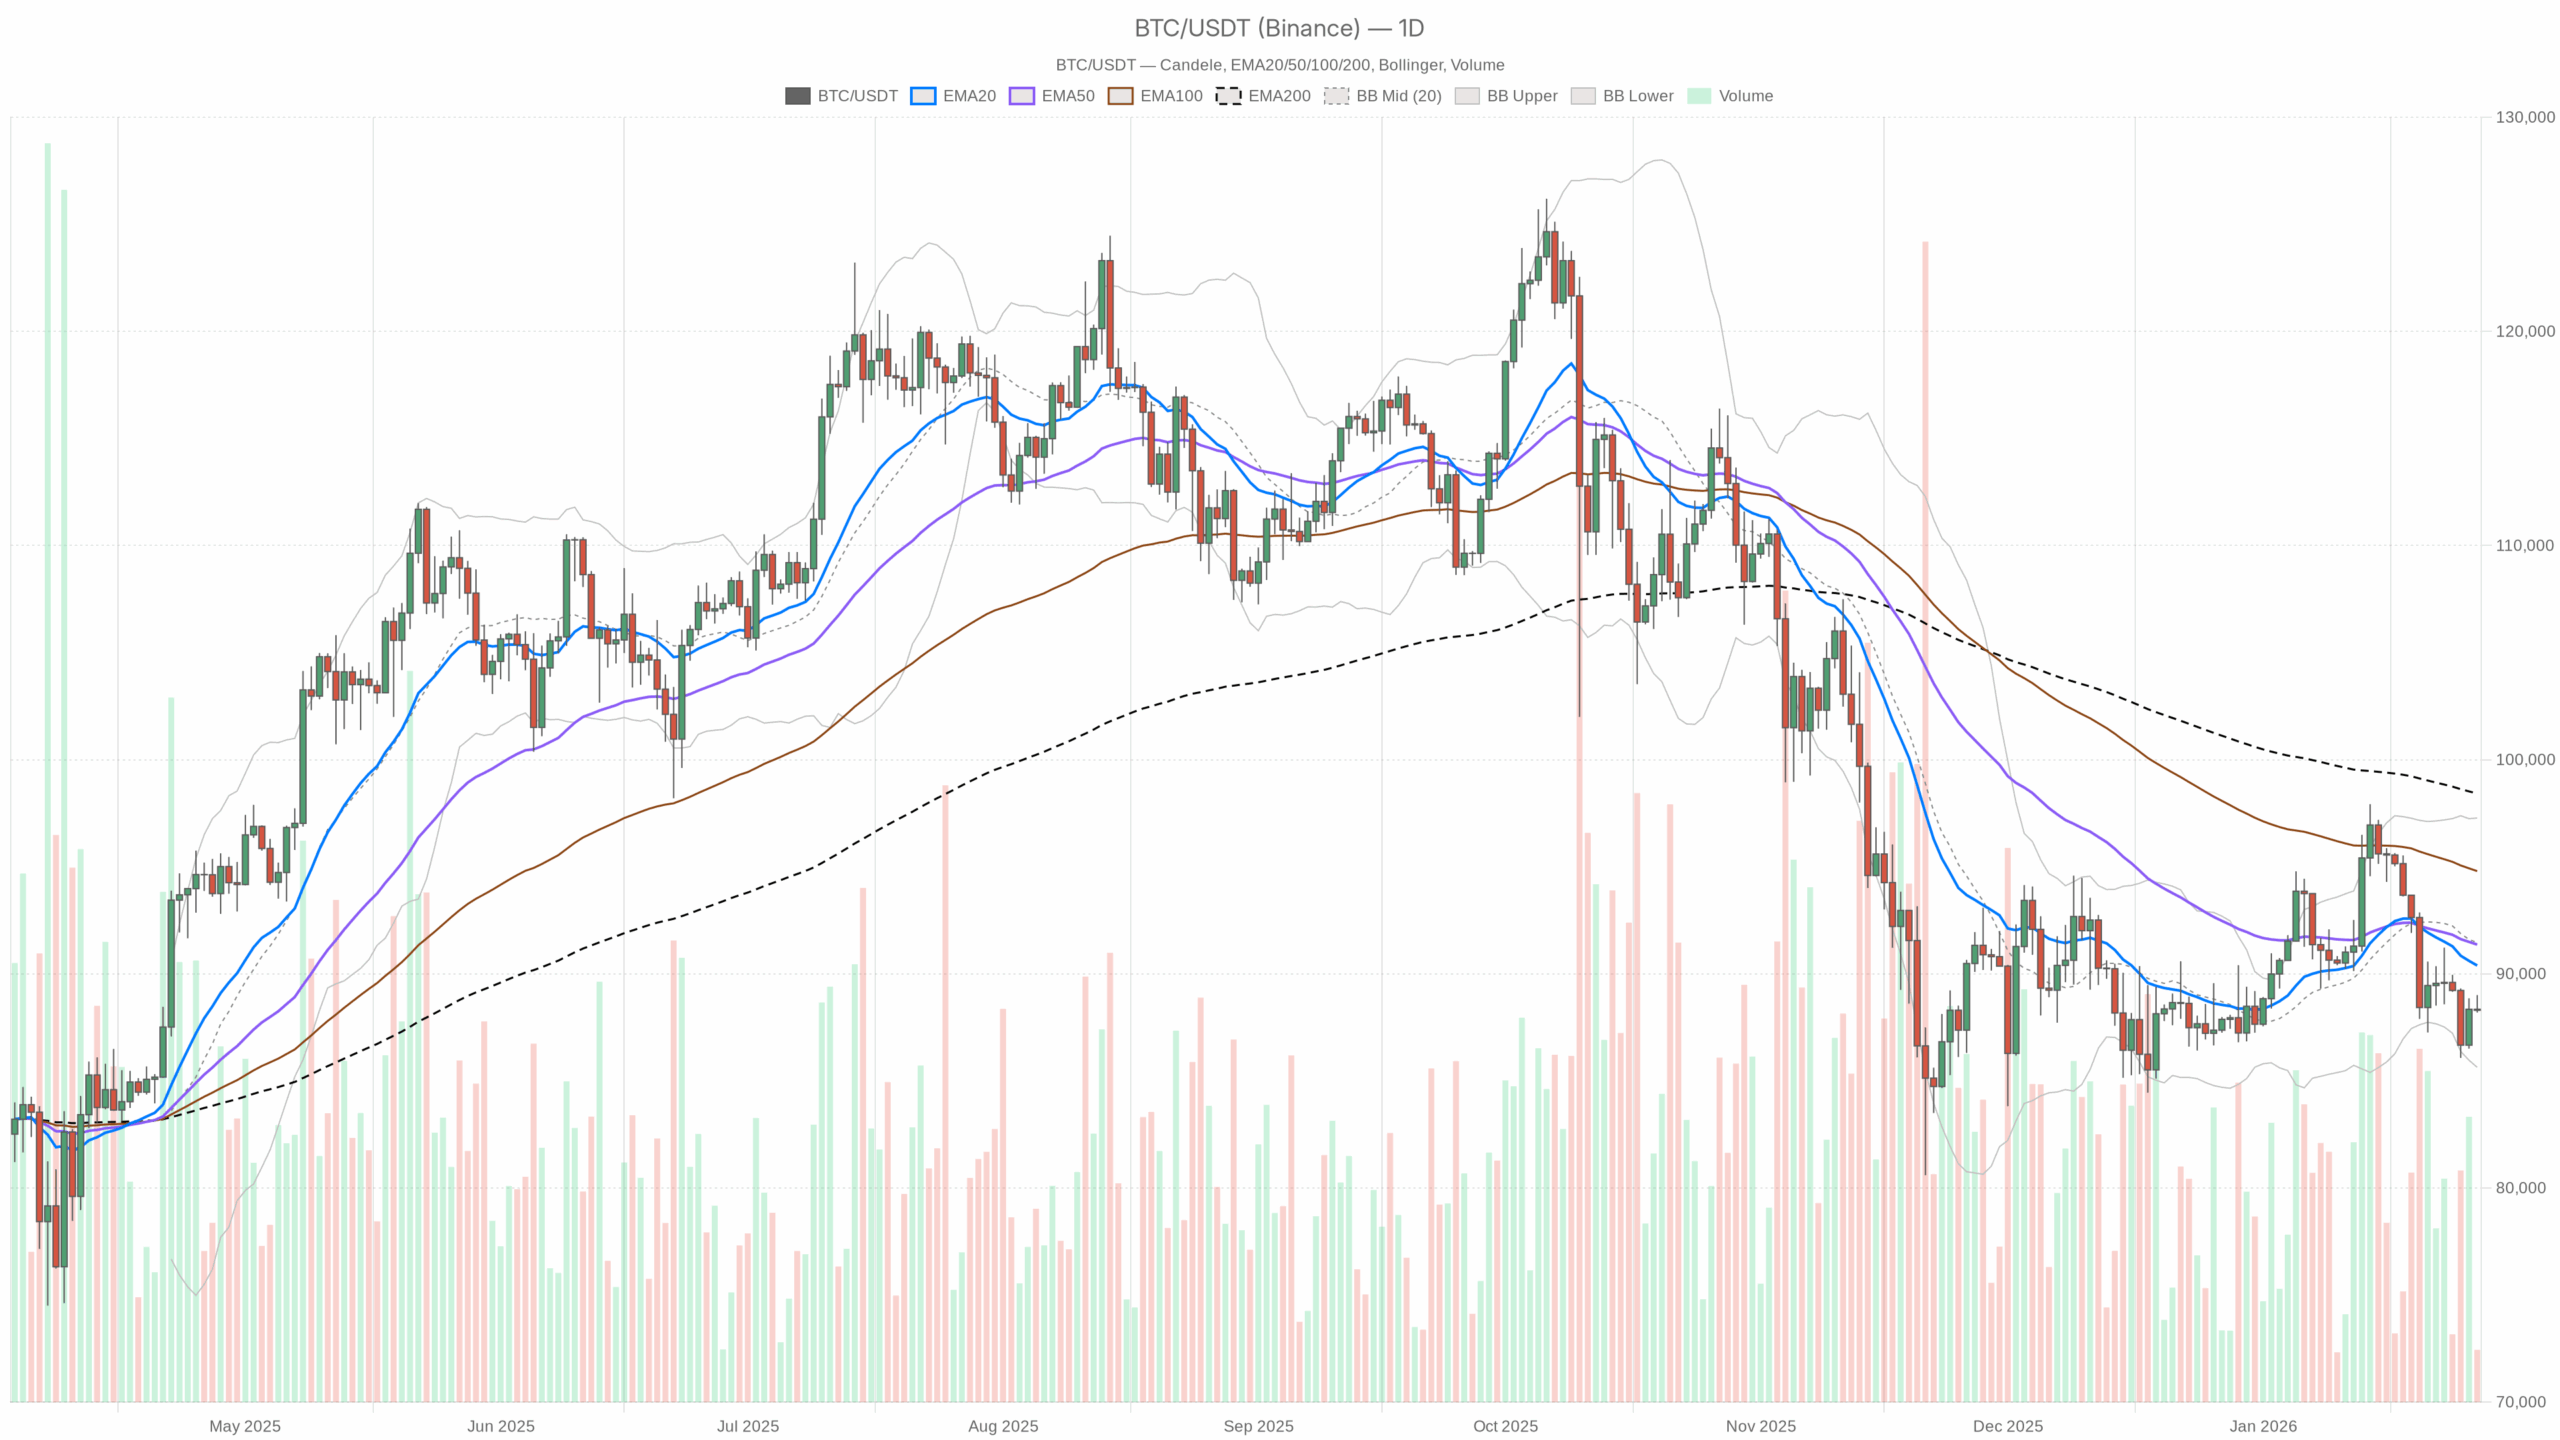
Daily timeframe (D1): primary bias – bearish correction
Daily close: $88,300 (roughly in line with the daily pivot at $88,501.61).
Trend structure – EMAs
• EMA 20: $90,388.33
• EMA 50: $91,368.53
• EMA 200: $98,420.36
Price is below all three EMAs and the system has flagged the daily regime as bearish. Short-term trend (20 EMA) is already below the medium-term (50 EMA), and both slope down toward price. The 200 EMA way up near $98k marks the bigger structural line in the sand.
What it implies: BTC is in a mature downside phase: rallies toward $90k–92k are currently more likely to be sold into than to start a sustained reversal, unless bulls reclaim and hold above that 50-day EMA.
Momentum – RSI (14)
• RSI (14): 42.13
RSI is below the midline but not oversold.
What it implies: Bears have the upper hand, but there is no exhaustion signal yet. This is classic pullback or correction territory, not a washed-out bottom. Price has room to push lower before value buyers are forced in by extreme readings.
Momentum & trend confirmation – MACD
• MACD line: -722.96
• Signal line: -63.91
• Histogram: -659.05
The MACD line is deep in negative territory and parked below the signal line, with a sizeable negative histogram.
What it implies: Downside momentum is established, not just a one-off dip. However, when MACD is this stretched on the downside, it often means the easy part of the move is behind us. You can still get lower lows, but they tend to be choppier and more mean-reverting rather than straight-line crashes.
Volatility & range – Bollinger Bands & ATR
• BB mid: $91,455.72
• BB upper: $97,276.58
• BB lower: $85,634.85
• ATR (14): $2,234.25
Bitcoin is trading below the mid-band and closer to the lower band, but not hugging it. ATR around $2.2k means a typical daily swing of about 2.5% relative to current price.
What it implies: We are in a controlled, moderately volatile downtrend. Price is leaning bearish inside the band structure, but there is no blowout volatility yet. The lower band near $85.6k is the first obvious stretch zone where short-term bounces often start.
Daily pivot levels
• Pivot point (PP): $88,501.61
• R1: $88,808.39
• S1: $87,993.21
Spot is trading just under the pivot. The first resistance is very close overhead, while first support is only a few hundred dollars lower.
What it implies: The market is coiling around an intraday equilibrium just under the pivot. Until BTC moves decisively away from this $88k area, we are likely to see short squeezes and long liquidations in both directions with no real trend change.
Hourly timeframe (H1): stabilization attempt around $88k
Hourly close: $88,305.87
Trend structure – EMAs
• EMA 20: $88,252.88
• EMA 50: $88,252.70
• EMA 200: $89,981.65
• Regime: neutral
Price is sitting right on top of the 20 and 50 EMAs, which are effectively flat and overlapping, while the 200 EMA is still above price.
What it implies: On the hourly chart, the sharp selling has paused and the market is trying to form a base around $88k. However, with the 200 EMA still overhead, this is more likely a pause in a downtrend than the start of a full trend reversal. Short-term players are trading both sides; longer-term bears still hold the structural edge.
Momentum – RSI (14)
• RSI (14): 52.17
RSI is marginally above 50.
What it implies: Intraday flows are slightly skewed to the buy side. This is consistent with a relief bounce or consolidation bounce within a broader daily down move, not a fresh bull leg.
Momentum – MACD
• MACD line: 141.94
• Signal line: 136.75
• Histogram: 5.19
The MACD line is marginally above the signal line with a tiny positive histogram.
What it implies: Bulls have wrestled back some very short-term momentum, but the edge is thin. This is the kind of MACD profile you see in sideways consolidation with a slight bullish tilt, not in a strong intraday trend.
Volatility & range – Bollinger Bands & ATR
• BB mid: $88,210.20
• BB upper: $88,925.63
• BB lower: $87,494.78
• ATR (14): $392.18
Price is just above the mid-band with bands moderately tight and ATR under $400.
What it implies: The hourly tape is relatively calm. Volatility compression like this after a selloff often precedes a directional move, either a continuation leg lower toward $87k and then $86k, or a squeeze back through $89k.
Hourly pivot levels
• Pivot point (PP): $88,301.24
• R1: $88,402.48
• S1: $88,204.63
Spot is sitting exactly on the hourly pivot.
What it implies: Short-term traders are in balance here. For execution, breakouts above R1 or below S1 are more meaningful than noise inside this narrow band.
15-minute timeframe (M15): execution context, not a signal
15m close: $88,305.87
EMAs & micro-structure
• EMA 20: $88,431.09
• EMA 50: $88,365.46
• EMA 200: $88,261.95
• Regime: neutral
Price is slightly below the 20 and 50 EMAs but just above the 200 EMA.
What it implies: On the smallest timeframe, BTC is chopping sideways with a minor downside lean. The 200 EMA around $88,260 acts as a very short-term pivot; losing it cleanly would open the door for a quick liquidity sweep lower.
Momentum – RSI & MACD
• RSI (14): 44.54
• MACD line: -40.63
• Signal line: -5.64
• Histogram: -34.99
RSI is under 50 and MACD is negative with the line below the signal.
What it implies: Very short-term impulse is skewed to the downside. This aligns with the idea that intraday rallies are being faded quickly by scalpers, even if the broader hourly tape is still in balance.
15m Bollinger Bands, ATR & pivots
• BB mid: $88,491.26
• BB upper: $88,836.23
• BB lower: $88,146.30
• ATR (14): $112.79
• Pivot point (PP): $88,271.56
• R1: $88,343.13
• S1: $88,234.31
Price sits just above the 15m pivot, with low ATR and relatively tight bands.
What it implies: Liquidity is concentrated in this narrow $88.2k–88.4k band. For anyone trading execution-level entries, this is a low-volatility zone where stop placement needs to be tight. A break out of this pocket usually triggers a quick $100–$200 expansion.
Market backdrop: risk appetite vs fear
Total crypto market cap is around $3.07T, up roughly 0.44% in 24h, but volume is down almost 18%. BTC dominance at 57.4% says Bitcoin is still the anchor of the space, even as flows thin out. The Fear & Greed Index at 29 (Fear) shows participants are cautious but not at panic extremes.
What it implies: This is a risk-off, not risk-collapse, environment. In such phases, Bitcoin often grinds lower or sideways while altcoins underperform on a beta basis. Moreover, mean-reversion bounces can be sharp, but they are typically sold unless there is a clear macro catalyst or a strong technical reclaim on the daily chart.
Bullish scenario for Bitcoin (counter-trend for now)
Given the daily data, any bullish view is still a counter-trend play.
What bulls need to do:
1. Hold and build above $88k on the hourly chart. The current balance around the hourly pivot (~$88.3k) must turn into a series of higher lows on H1, ideally defended on dips toward $87.5k–$88k.
2. Break and hold above $89k–$90k. That zone contains the hourly 200 EMA and sits just below the daily 20 EMA. A sustained push through it would mark the first meaningful sign that bears are losing control.
3. Daily close back above the 20 EMA (~$90.4k), and ideally a follow-through day targeting the 50 EMA near $91.4k.
If bulls manage this sequence, a reasonable upside path opens toward:
• First resistance in the $91k–$92k band (daily 50 EMA and BB mid).
• Then potentially the $95k–$97k area (upper half of the daily Bollinger channel), where you would expect profit-taking in the absence of a strong macro catalyst.
What would invalidate the bullish scenario: A clean daily close below the lower Bollinger band support around $85.6k, especially if accompanied by RSI rolling down toward the mid-30s, would signal the bounce attempt failed and the market has chosen continuation lower instead of mean reversion.
Bearish scenario for Bitcoin (aligned with daily trend)
The dominant force is still the daily downtrend. As long as BTC trades below the 20 and 50 EMAs, shorts and defensive positioning have the structural advantage.
How bears press the advantage:
1. Defend $89k–$90k on intraday rallies. If every move into that zone gets sold and H1 fails to close above the 200 EMA near $89,982, it confirms sellers are still in control of the supply overhang.
2. Push BTC below $87.5k and then $86k. That would pull price closer to the daily lower Bollinger band (~$85.6k) and keep MACD deeply negative, confirming trend continuation.
3. Maintain RSI under 50 on the daily timeframe. As long as daily momentum stays on the bearish side of the ledger, dips are more likely to extend than fully reverse.
Under this scenario, the downside path is:
• First tactical support: around the lower daily band, $85.5k–$86k.
• If that breaks convincingly, a broader flush toward the $82k–$83k region becomes possible, where you would expect more aggressive dip-buying interest and a stronger volatility spike.
What would invalidate the bearish scenario: A sustained daily close above $91.5k (firm reclaim of both the 20 and 50 EMAs) with MACD histogram shrinking toward zero and RSI moving back over 50 would mark a significant shift. At that point, the dominant narrative would flip from sell rallies to buy dips, and the current bearish thesis would be off the table.
Where this leaves traders and investors
The multi-timeframe picture is clear:
• Daily: bearish, with BTC below key EMAs and leaning toward the lower half of the Bollinger range.
• Hourly: neutral, trying to carve out a base around $88k with modest bullish momentum.
• 15m: noisy, slightly bearish and best used only for fine-tuning entries and exits.
Bitcoin is in a classic corrective phase where the higher timeframe trend (down) clashes with short-term attempts to stabilize. That usually translates into two-sided volatility and fake breakouts, especially around obvious levels like $88k, $90k, and the daily bands.
For positioning, the important takeaways are:
• Short-term traders are dealing with moderate volatility (ATR about $2.2k on the daily) and compressed intraday ranges. That is a recipe for sharp expansions once one side overextends.
• Larger time-horizon participants are watching the $85.5k–$86k support band and the $90k–$92k resistance pocket as the key decision zones. Breaks and retests around those levels will define whether this is just another dip in a larger bull cycle or the start of a deeper structural correction.
In short, the market is defensive but not broken. As long as daily momentum stays below key moving averages, downside risk and the potential for further grinding losses remain in play, even if tradable bounces appear along the way. No technical setup is guaranteed; the only constant here is uncertainty, and sizing, timing, and risk limits matter more than a single directional bet.
If you want to monitor markets with professional charting tools and real-time data, you can open an account on Investing using our partner link:
Open your Investing.com account
This section contains a sponsored affiliate link. We may earn a commission at no additional cost to you.
Disclaimer: This article is a market commentary for informational and educational purposes only. It is not investment, trading, or financial advice, and it should not be the sole basis for any decision. Cryptoassets are highly volatile and you should carefully assess your risk tolerance and do your own research before entering the market.