

The market is trying to rebound after a corrective move, with Bitcoin price today attempting a short-term bounce while the broader structure remains under pressure.
Summary
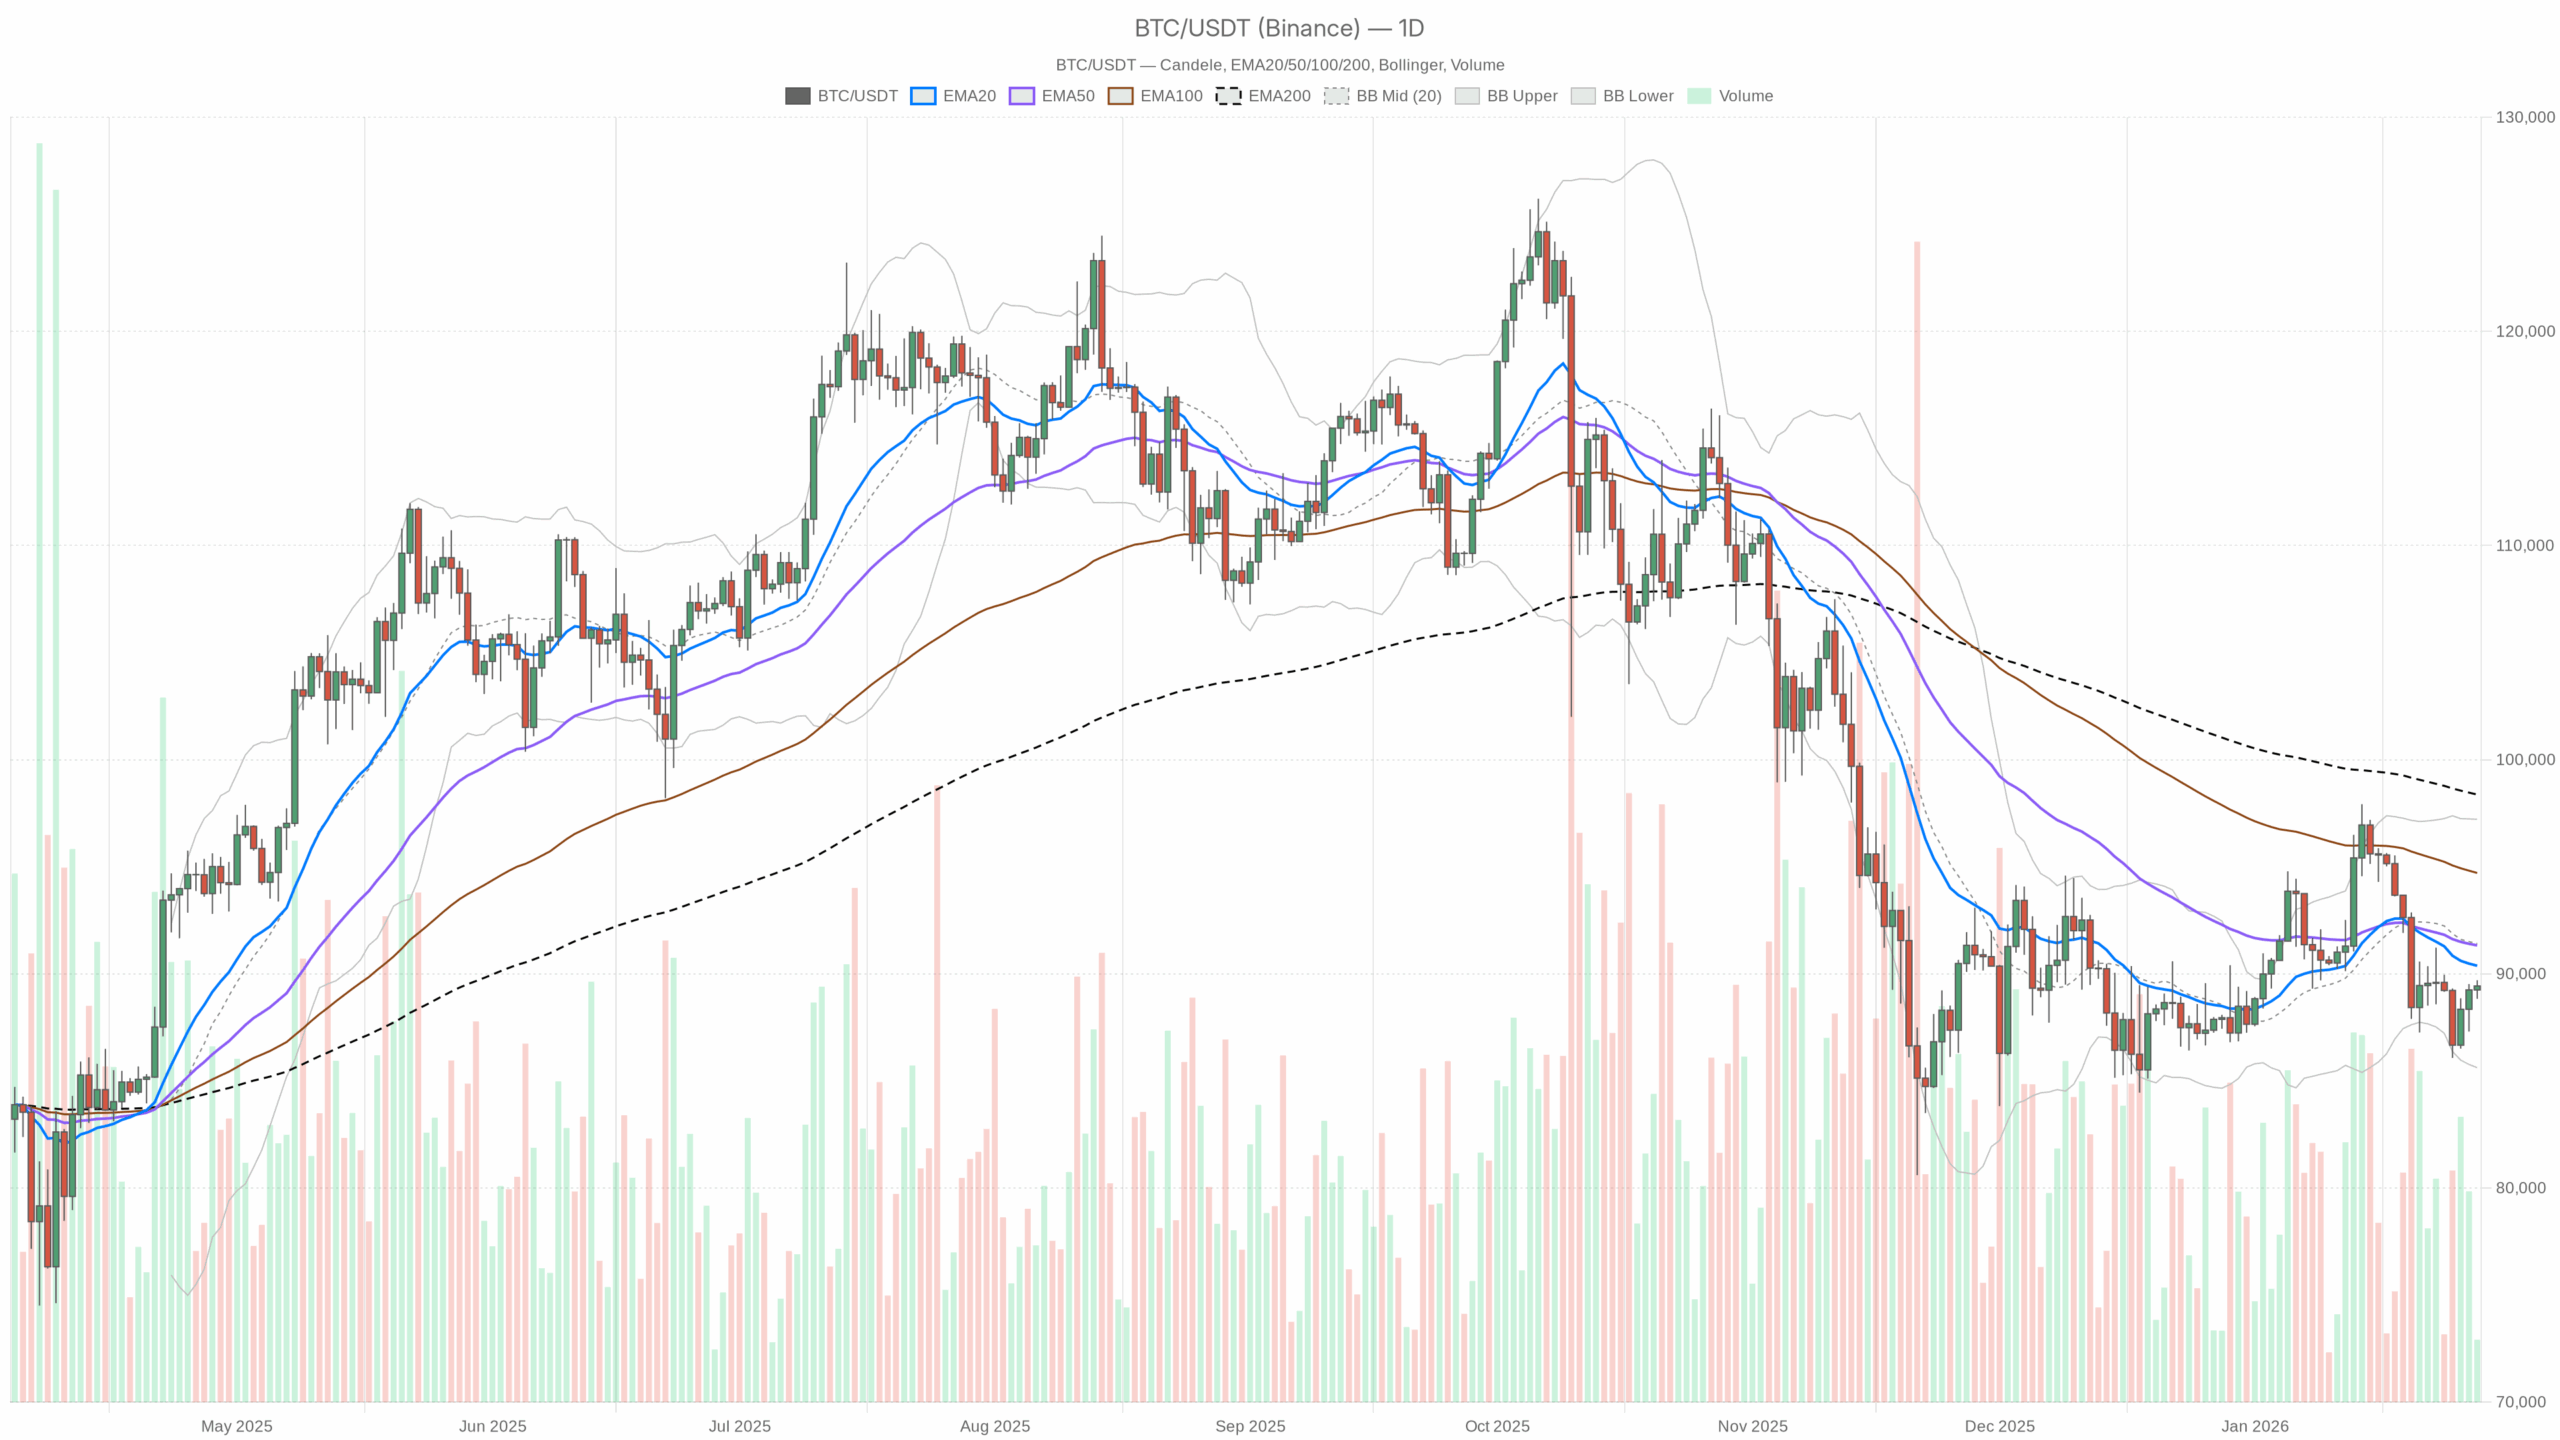
Macro Bias (Daily Chart – D1): Bearish Correction
The daily timeframe sets the main scenario: bearish / corrective.
EMAs (trend structure)
On D1, BTCUSDT trades at $89,433, below the 20-day EMA at $90,379, the 50-day EMA at $91,328, and well under the 200-day EMA at $98,374.
That stack – price under 20, 50, and 200 – is classic downtrend behavior. Short- and medium-term trend followers are still in control on the downside, and the long-term trend is flattening after the parabolic run. However, until price can reclaim at least the 20- and 50-day EMAs, rallies are technically just bounces within a broader correction.
RSI 14 (momentum)
The daily RSI is at 46.1, sitting just below the midline.
Momentum is no longer overheated, but it is not washed out either. This is a mid-range RSI in a downswing: sellers have the edge, but there is room both to extend lower and to bounce. It fits the idea of a cool-off phase after a strong prior uptrend, not a panic liquidation.
MACD (trend momentum confirmation)
Daily MACD line is at -641.6, signal at -167.3, with a negative histogram of -474.3.
The line under the signal and a fat negative histogram confirm that downside momentum is still active on the higher timeframe. Bears still have follow-through, and any short-term rally is swimming against this backdrop until we see the histogram shrink meaningfully or a cross back up.
Bollinger Bands (volatility & positioning)
On D1, the Bollinger mid-band (20-period basis) is at $91,420, the upper band near $97,221, and the lower band around $85,619. Price is at $89,433, below the mid-band and above the lower band.
Bitcoin is trading in the lower half of the band range, but not hugging the lower band anymore. That typically signals a cooled-off selloff: bears drove price down toward the lower band, and now the market is trying to stabilize rather than free-fall. Volatility is still sizable, but we are not at extreme compression or extreme expansion here.
ATR 14 (daily volatility)
Daily ATR sits around $2,156.
A roughly $2k daily swing is still large in absolute terms but reasonably modest relative to an approximately $89k price. The market remains volatile, but this is not the wild blow-off or crash regime. Instead, it is consistent directional volatility, which trend traders like, but position sizing needs to respect it.
Daily Pivot Levels
For the current daily session, the main pivot is at $89,323, with first resistance R1 at $89,813 and first support S1 at $88,943.
Price is hovering almost exactly on the pivot. That is textbook equilibrium for the day: neither side has forced a clear breakout intraday yet. The first battle lines are tight – lose S1 decisively and sellers regain momentum; reclaim R1 and we start talking about a push toward the EMA cluster above.
Intraday Picture (H1 & M15): Bounce Against the Higher-Timeframe Downtrend
H1 – Short-Term Bias: Neutral to Slightly Bullish
On the 1-hour chart, BTCUSDT is trading around $89,401. Here, the structure looks different from the daily.
H1 EMAs
Price is currently above the 20-hour EMA at $88,997 and the 50-hour EMA at $88,657, but sitting just under the 200-hour EMA at $89,619. Regime is tagged as neutral.
Intraday, buyers have managed to get back on top of the fast and medium EMAs, which usually marks a short-term bounce. However, the 200-hour EMA overhead is capping price. This is often where counter-trend rallies stall inside a bigger downtrend. So the H1 is trying to turn up, but it has not broken the larger ceiling yet.
H1 RSI & MACD
The 1-hour RSI is at 57.8.
Momentum on H1 leans to the upside but is not overheated. This is the sweet spot for a controlled grind higher rather than a blow-off spike. It is supportive for scalpers and day traders on the long side, as long as the daily bears do not step back in aggressively.
H1 MACD line is at 272.0, signal at 266.1, with a small positive histogram of 5.9.
We do have a bullish configuration here, but the histogram is barely positive, which tells you the upside momentum is fragile. Buyers are in charge intraday, but they are not steamrolling shorts. It is a tentative advantage.
H1 Bollinger Bands & ATR
On the hourly chart, the Bollinger mid-band is at $88,980, with the upper band near $90,017 and the lower band near $87,942. Price is trading just below the upper band.
Being near the top of the hourly band after a bounce shows buyers have pushed the move as far as they reasonably can in this first leg. It often leads to either a brief consolidation or a shallow pullback before the next decision. It does not scream immediate reversal, but it does say you are no longer buying a cheap dip on this timeframe.
H1 ATR is roughly $370.
Hourly swings of $300–$400 are significant for day traders but normal at this price level. It means intraday trades need room to breathe. Tight stops will get chopped up quickly around key levels like the pivot and 200 EMA.
H1 Pivot Levels
The hourly data references a daily-style pivot: PP $89,502, R1 $89,603, S1 $89,300. Current price (around $89,401) is sitting between S1 and the pivot.
This reinforces the idea of a market stuck in a narrow decision zone. Bulls need to reclaim and hold above $89,500–89,600 to open up a push into $90k and beyond. Lose $89,300 with momentum, and the short-term bounce looks tired.
M15 – Execution Context: Short-Term Bullish
On the 15-minute chart, BTCUSDT is also at $89,401, with a bullish regime printed.
M15 EMAs
Price is trading above all key EMAs: the 20-EMA at $89,213, the 50-EMA at $89,082, and the 200-EMA at $88,585.
This is the cleanest uptrend structure across our three timeframes. For very short-term traders, the path of least resistance is currently up, with the 20-EMA as immediate dynamic support and the 50 and 200 below as deeper levels where dip buyers might step in.
M15 RSI & MACD
15-minute RSI comes in at 57.8.
Similar to H1, this is bullish but not stretched. The intraday rally still has fuel, but the easy part of the move, from oversold to neutral, is likely behind us. From here it is more about whether buyers can sustain control.
M15 MACD line prints 72.8 versus signal at 30.9, with a positive histogram of 41.9.
That is a firm short-term bullish impulse. Intraday buyers have momentum on their side. Unless this starts rolling over, with the histogram shrinking and then flipping, shorting aggressively on this tiny timeframe is basically stepping in front of a moving car.
M15 Bollinger Bands & ATR
On M15, the Bollinger mid-band is at $89,189, the upper band at $89,560, and the lower band at $88,818. Price sits just below the upper band.
The local move is already pressing the short-term envelope. That normally leads to sideways digestion or a mild pullback, but in strong intraday trends, price can ride the band for a while. The key is how it reacts on small dips back to the mid-band around $89,200.
M15 ATR is around $200.
Short-term volatility is high enough that 0.2–0.3% swings can happen in a few candles. For scalpers, that is opportunity; for overleveraged traders, it is a recipe for getting wicked out.
M15 Pivot Levels
The same pivot set applies here: PP $89,502, R1 $89,603, S1 $89,300. On a 15-minute outlook, this zone acts as a very local battlefield.
Staying above $89,300 keeps the short-term uptrend intact. However, repeated failures under $89,500–89,600 would show that higher-timeframe sellers are leaning on this level.
Market Context: Fearful Sentiment, BTC-Led Market
The broader crypto market capitalization is about $3.12T, up roughly 2.1% over 24h, with Bitcoin dominance at approximately 57.3%. Volume is up about 6% in the last day.
So despite a corrective structure in BTC, money is not fleeing the space; it is rotating toward Bitcoin. Combined with the Fear Index at 29, we are in that familiar zone where investors are nervous but still active. Historically, this is where medium-term bottoms can form, but only once price structure actually confirms it. Right now the structure is still pointing to a downtrend on D1.
Putting It All Together: Scenarios
Timeframes are in tension: the daily is in a bearish correction, the 1H is trying to stabilize, and the 15m is clearly bullish. That usually resolves one of two ways. Either the short-term strength rolls over and joins the daily downtrend, or the intraday strength grows into a fuller daily mean-reversion rally.
Bullish Scenario (Counter-Trend Rally)
For bulls, the play is a continuation of the current intraday bounce into a deeper daily retrace.
What bulls want to see:
First, intraday, BTC needs to hold above $89,300 (S1) and flip the $89,500–89,600 zone (pivot plus R1 and H1 200 EMA area) into support. That would signal that short-term buyers are not just scalping, they are actually absorbing supply from higher-timeframe sellers.
Next, a push toward the daily 20-day EMA at approximately $90,400 and the 50-day EMA at about $91,300 would be the logical upside extension. That area is a heavy confluence: EMAs plus the Bollinger mid-band around $91,400. If bulls can break and close daily candles above that cluster, the character of this move changes from a dead-cat bounce to a genuine attempt to resume the larger uptrend.
On indicators, you would expect:
- Daily RSI pushing back above 50 and climbing.
- Daily MACD histogram shrinking in absolute value, becoming less negative, then curling higher.
- Price walking back toward the Bollinger mid-band instead of living in the lower half.
What invalidates the bullish scenario?
If BTC fails to reclaim $89,500–89,600 and starts closing below $88,900–89,000 (around S1 on D1, and back into the lower hourly band), the idea of a constructive bounce weakens. A swift break under the daily lower band support near $85,600 with expanding ATR would outright kill the short-term bullish view and put bears firmly back in control.
Bearish Scenario (Daily Downtrend Resumes)
The bearish thesis is that what we are seeing now is just a relief rally into resistance before another leg lower.
What bears are looking for:
Intraday, failure around the $89,500–90,000 band is key. If the 15m and 1H RSI start rolling over from the high-50s toward 50 and below, and MACD on those timeframes flips back down, that would show momentum turning.
A clean rejection from the H1 200 EMA, near $89,600, followed by a break back below $89,000 would be the first strong hint that the daily downtrend is reasserting. From there, bears will be eyeing:
- The daily support band between the current price and the lower Bollinger band at approximately $85,600.
- A possible volatility spike, with rising ATR, on breaks of local support, signaling forced unwinds rather than orderly profit-taking.
If selling accelerates and price begins riding the lower daily band, the next phase of the correction is underway. Daily RSI drifting from the mid-40s into the high-30s would confirm that momentum has flipped firmly back to the downside.
What invalidates the bearish scenario?
For bears, a strong daily close back above the $91,000–91,500 cluster, including the 20 and 50 EMA plus the Bollinger mid, would be a major warning sign. That would mean the market has reclaimed the core of the prior breakdown area. Follow-through that pushes price toward the 200-day EMA near $98,400 would all but invalidate the near-term bearish structure and shift the narrative back to trend continuation.
How to Think About Positioning Now
The Bitcoin price today setup is caught between a fearful macro mood and a still-resilient crypto complex, with BTC dominance high and intraday charts hinting at a bounce.
For traders, the key is to respect the timeframes:
- Short-term participants, such as scalpers and day traders, are trading a bullish intraday tape, but they are trading into heavier resistance above.
- Higher-timeframe participants are still looking at a corrective daily structure, where rallies into the EMA cluster are suspect until proven otherwise.
Volatility is elevated but not extreme. The market can move a couple of thousand dollars in a day without changing the bigger picture, which means leverage and stop placement matter more than usual. Neither direction is a layup right now: bulls are fighting the trend, and bears are fighting growing evidence of dip demand.
As always, any strategy needs to be sized for the possibility that both scenarios above are wrong in the short run, especially in a market running on high notional prices, a fearful sentiment backdrop, and very active derivatives flows.
If you want to monitor markets with professional charting tools and real-time data, you can open an account on Investing using our partner link:
Open your Investing.com account
This section contains a sponsored affiliate link. We may earn a commission at no additional cost to you.
Disclaimer: This analysis is for informational and educational purposes only and is based solely on the data provided. It does not constitute investment, trading, or financial advice, and it should not be the basis for any investment decision. Cryptoassets are highly volatile and carry significant risk, including the risk of total loss. Always conduct your own research and consider your risk tolerance before engaging in any trading or investing activity.
In summary, price action reflects a daily corrective downtrend challenged by intraday bullish flows, with sentiment fearful but capital still rotating toward BTC rather than exiting the market entirely.