

XRP is trading around $1.74 against USDT and sitting on short-term support after a sharp risk-off move across the crypto market, as the ripple crypto price reacts to broad deleveraging.
Summary
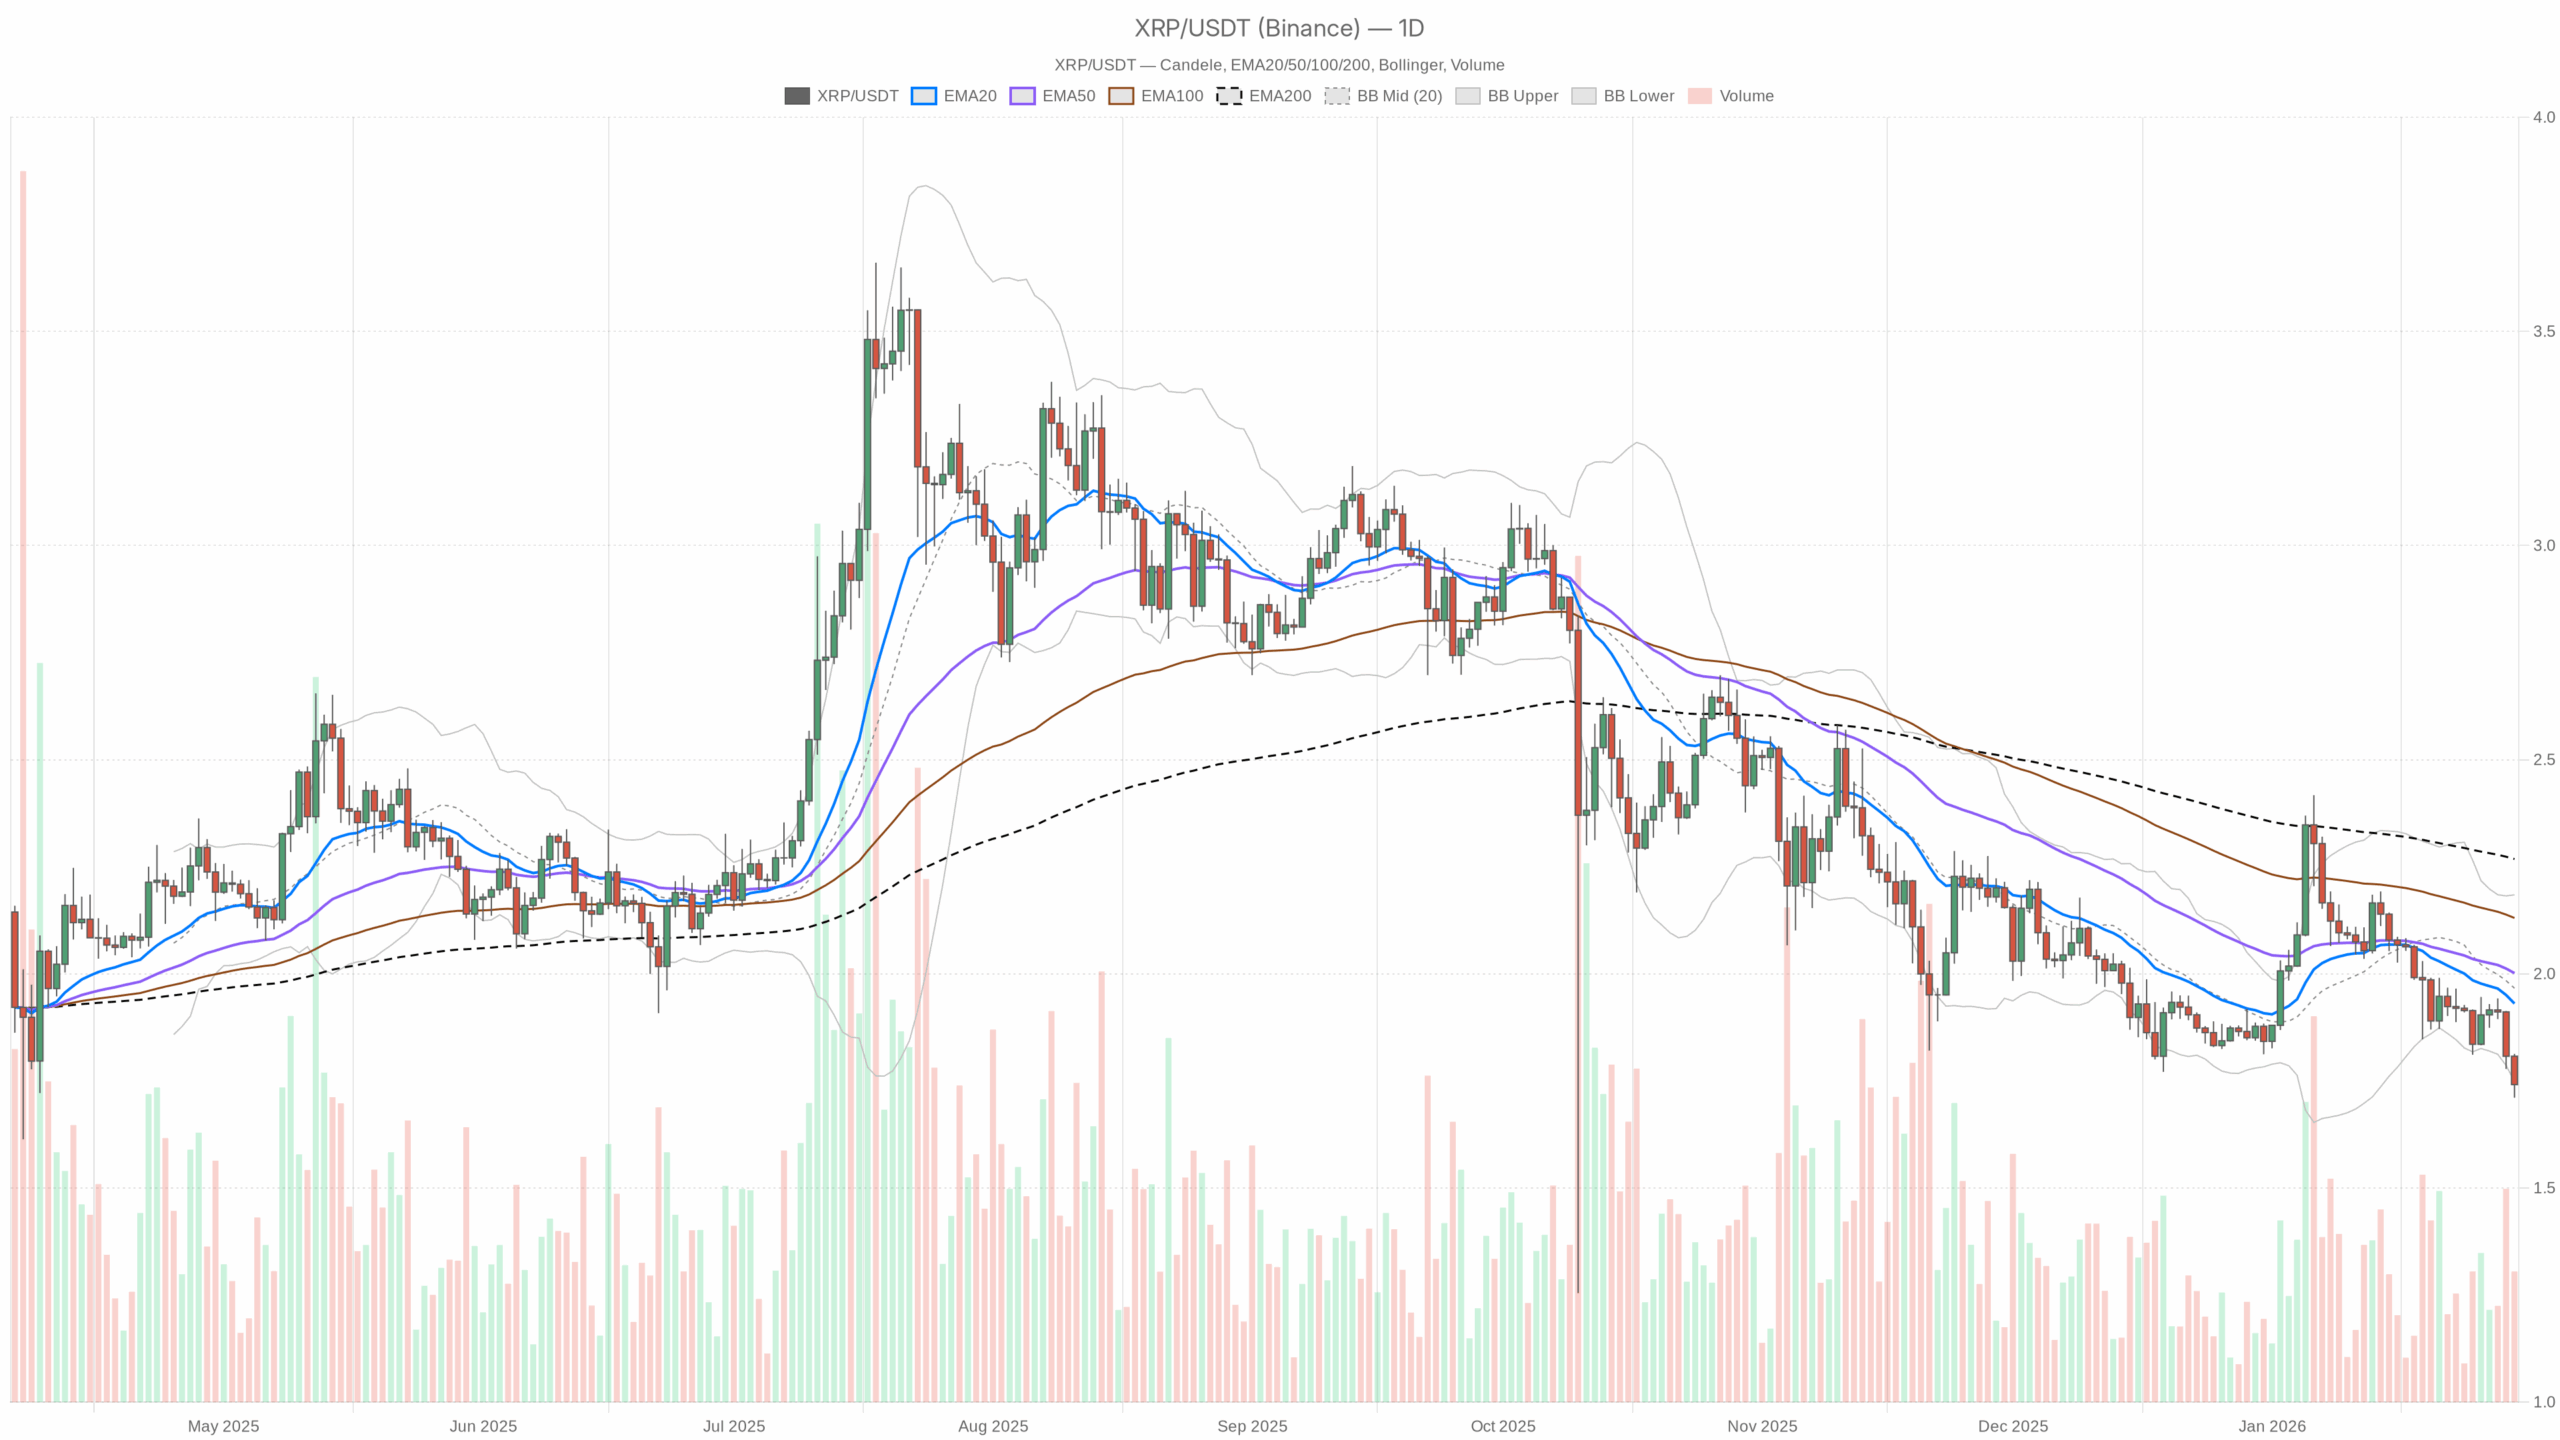
Daily Chart (D1): Main Scenario and Structure
On the daily timeframe, XRPUSDT is firmly in a bearish regime. Price is below all key EMAs and hugging the lower Bollinger Band, while momentum remains weak.
Trend: EMAs on D1
– Price (close): $1.74
– EMA 20: $1.93
– EMA 50: $2.00
– EMA 200: $2.27
XRP is trading below the 20, 50, and 200-day EMAs, with a clean bearish ordering (price < EMA20 < EMA50 < EMA200). The short-term moving averages are rolling over and pulling away from price. This is the textbook signature of a dominant downtrend: rallies are more likely to be sold than extended.
In plain terms, the long side is fighting the current here. Any bullish attempt has to first reclaim the 20-day EMA near $1.93 before we can even talk about a serious trend shift.
Momentum: RSI and MACD on D1
– RSI 14: 32.82
– MACD line: -0.06
– MACD signal: -0.03
– MACD histogram: -0.02
The daily RSI at ~33 is sitting just above oversold territory. That tells us sellers have been in control for days, but we are not yet in true washout conditions. This kind of reading often allows further downside before a strong bounce. However, it also means we are getting closer to areas where dip-buyers start to appear.
The MACD is negative and the histogram is slightly below zero, hinting that bearish momentum is still present but no longer accelerating dramatically. It looks more like a controlled downtrend than vertical panic selling. Bears remain in charge, but they are not hitting the market with maximum force.
Volatility and Bands: Bollinger Bands & ATR on D1
– Bollinger Bands (20):
• Midline: $1.97
• Upper band: $2.18
• Lower band: $1.75
– ATR 14: $0.09
Price is sitting right on the lower Bollinger Band at ~$1.75. This shows the Ripple crypto price is stretched to the downside in the short term. When candles start riding the lower band, it typically means we are in a trend leg down, not just a random dip. Mean reversion trades work, but only if the trend starts to fatigue; otherwise, price can walk the band lower.
The ATR around $0.09 is elevated but not explosive for XRP at these levels. Volatility is up compared to calm periods, yet we are not seeing the kind of wild $0.20–0.30 daily swings that scream capitulation. That fits the picture of a steady bleed in a fearful market rather than a one-day crash.
Daily Pivot Levels on D1
– Pivot point (PP): $1.76
– Resistance 1 (R1): $1.80
– Support 1 (S1): $1.70
Today’s daily close at $1.74 is slightly below the pivot at $1.76 and very close to the lower Bollinger Band. That pins XRP in a fragile area: a decisive push under $1.70 (S1) would open the door to another leg lower. Conversely, reclaiming the pivot and holding above $1.80 would be the first small sign that buyers are willing to step in.
Main scenario from the daily chart: bearish. We are in a trend-down environment with weak, but not exhausted, momentum and a market-wide fear backdrop. The burden of proof is on the bulls.
Hourly Chart (H1): Intraday Confirmation
The 1-hour chart backs the daily bearish story. There is no clear sign yet of a strong intraday reversal, only some mild stabilization.
Trend: EMAs on H1
– Price (close): $1.74
– EMA 20: $1.78
– EMA 50: $1.83
– EMA 200: $1.89
On H1, price sits below all intraday EMAs, mirroring the daily structure. The short-term moving averages are stacked bearish, confirming a downtrend on both macro (D1) and tactical (H1) levels. That kind of alignment usually means any bounce into $1.78–1.83 is likely to meet selling interest from intraday traders.
Momentum: RSI and MACD on H1
– RSI 14: 31.34
– MACD line: -0.03
– MACD signal: -0.03
– MACD histogram: 0.00
The hourly RSI around 31 is near oversold levels, telling us the most immediate leg down has been heavy. It leaves room for short, reactive bounces, but not enough to change the broader picture on its own.
The MACD is flat and negative, with the histogram at 0. That signals a loss of intraday momentum. In other words, bears are not accelerating the move anymore, but bulls are not taking over either. The market is pausing within a downtrend, which is often a prelude to either a small relief rally or another grind lower.
Volatility and Bands: Bollinger Bands & ATR on H1
– Bollinger Bands (20):
• Midline: $1.78
• Upper band: $1.83
• Lower band: $1.72
– ATR 14: $0.02
Hourly price is hovering between the mid and lower band, leaning bearish but not in freefall. The ATR at $0.02 means typical hourly candles are moving within a 1–1.5% range. For intraday traders, that is enough volatility to trade, but it is not a blowout. The structure still favors sell-the-bounce tactics while price remains capped below the mid-band around $1.78–1.80.
Hourly Pivot Levels on H1
– Pivot point (PP): $1.74
– R1: $1.74
– S1: $1.74
The automated system gives a tight pivot cluster at $1.74, effectively marking the current battle line. Price sitting directly on this level shows the market is at a short-term decision point: hold and bounce, or slip and extend lower. Given the broader context, sellers still have the upper hand while we stay under the H1 EMAs.
15-Minute Chart (M15): Execution Context
The 15-minute timeframe is not about long-term direction; it is about timing trades within the existing daily downtrend. Here, the picture is slightly less heavy but still not bullish.
Trend: EMAs on M15
– Price (close): $1.74
– EMA 20: $1.75
– EMA 50: $1.77
– EMA 200: $1.83
On M15, price is sitting right under the 20-period EMA and below the 50 and 200. Short-term, this shows attempts to stabilize after the drop, but no convincing recovery yet. Scalpers will watch the $1.75–1.77 region as the immediate intraday line in the sand for any bounce attempt.
Momentum: RSI and MACD on M15
– RSI 14: 42.43
– MACD line: -0.01
– MACD signal: -0.01
– MACD histogram: 0.00
The 15-minute RSI near 42 has recovered from oversold levels and is now in a neutral-but-weak zone. Selling pressure has cooled down in the very short term, but buyers are not dominating. This often precedes a sideways consolidation or choppy range.
The MACD is flat and slightly negative with no clear edge. That aligns with a market catching its breath after a move, where direction is unclear on the micro timeframe but still bears a downward bias from higher timeframes.
Volatility and Bands: Bollinger Bands & ATR on M15
– Bollinger Bands (20):
• Midline: $1.75
• Upper band: $1.77
• Lower band: $1.73
– ATR 14: $0.01
Price is oscillating around the midline of the 15-minute bands, between $1.73 and $1.77. With ATR at $0.01, micro-volatility is modest. This is the type of environment where breakout traders can get chopped up unless they align trades with the dominant daily direction, which remains down.
Bullish Scenario for the Ripple Crypto Price
For XRP to mount a credible bullish case from here, it needs to transform this oversold, fearful backdrop into a mean-reversion and trend-repair move. The broader crypto market context will be crucial.
What bulls need to accomplish:
1. Hold and defend $1.70–1.75
This zone combines the lower daily Bollinger Band (~$1.75) and the first support at $1.70. If buyers can keep daily closes above $1.70, the market avoids a fresh breakdown and keeps the door open for a squeeze higher.
2. Reclaim the daily pivot and 20-day EMA
First step: push back above the daily pivot at $1.76 and then sustain price above the $1.80 intraday resistance area. The more important structural win would be a move back above the D1 EMA20 at ~$1.93. That would signal that the most aggressive phase of the downtrend is done.
3. Momentum repair
A bullish recovery would be accompanied by the daily RSI lifting back above 40–45 and the MACD histogram moving toward or above zero. That would reflect genuine buying rather than just a short-covering pop.
If these steps play out, XRP could target the $2.00–2.18 area, where the EMA50 and upper Bollinger Band sit. That zone would likely act as a major decision point: either the larger uptrend from previous months resumes, or sellers reload there.
What invalidates the bullish scenario?
A clean daily close below $1.70 with expanding volume and ATR ticking higher would undermine the idea of a simple mean-reversion bounce. In that case, the market is not stabilizing; it is breaking down, and the bullish setup is off the table until a new base forms lower.
Bearish Scenario for the Ripple Crypto Price
The bearish side has the wind at its back right now: macro fear, BTC dominance up, daily and hourly trends down, and price stuck under all major EMAs. Moreover, altcoins are under broad pressure as traders de-risk.
What bears are looking for:
1. Failure at $1.78–1.83 on intraday bounces
As long as the Ripple crypto price fails to reclaim the H1 mid-Bollinger band and EMAs (roughly $1.78–1.83), rally attempts are likely to be sold. That keeps the structure of lower highs intact.
2. Break of $1.70 support
A firm move below the daily S1 at $1.70, backed by rising ATR and a drop of RSI toward or below 30, would mark a fresh leg lower in the downtrend. That would confirm that the current consolidation was just a pause before continuation.
3. Continuation of risk-off conditions
With the fear & greed index deep in Extreme Fear (16) and total crypto market cap already off almost 6% in 24 hours, a further slide in the broader market would put additional pressure on XRP. If BTC dominance keeps grinding higher, altcoins remain on the defensive, making it easier for the bearish trend in XRP to extend.
Under this scenario, downside targets would depend on how aggressive the move becomes. Structurally, the focus would be on prior demand zones below $1.70 and any round-number supports that start to attract buyers. Without fresh on-chain or fundamental catalysts, purely technical selling can overshoot fair value in panicky conditions.
What invalidates the bearish scenario?
If XRP reclaims and holds above $1.93 (the daily EMA20) on a closing basis, the character of this move changes from trend continuation to potential trend repair. A sustained break above $2.00–2.05 with RSI back above 50 would further weaken the bearish argument, signaling that sellers have lost control of the tape in the short-to-medium term.
How to Think About Positioning Now
Right now, XRP is in a downtrend on all major timeframes, pressured by a fearful macro environment and a defensive shift across crypto. Momentum is weak but not yet capitulatory, and volatility is elevated but controlled.
For traders, the message is straightforward: the path of least resistance is still down unless bulls can defend $1.70 and start reclaiming EMAs on H1 and D1. Short-term bounces are likely in this kind of sentiment. However, as long as price stays under $1.93 and especially under $2.00, they are better framed as rallies within a broader downtrend, not a new bull leg.
Whatever the bias, risk management matters more than direction here. With the market in Extreme Fear and liquidity thinning out in alts, single candles can move several percent against positions in minutes. Position sizing, clear invalidation levels (especially around $1.70 and $1.93), and respect for volatility are essential if you choose to engage XRP at these levels.
If you want to monitor markets with professional charting tools and real-time data, you can open an account on Investing using our partner link:
Open your Investing.com account
This section contains a sponsored affiliate link. We may earn a commission at no additional cost to you.
Disclaimer: This article is a market analysis and reflects a technical view of current conditions. It is not investment advice or a recommendation to buy or sell any asset. Crypto markets are highly volatile, and you should do your own research and assess your risk tolerance before making any trading decisions.
In summary, XRP remains under pressure in a controlled downtrend across multiple timeframes, with key levels at $1.70, $1.93, and the $2.00–2.18 zone likely to define the next directional move.