

In a market dominated by Bitcoin and stables, Ethereum value is sitting at a discount while sentiment remains locked in extreme fear across the crypto complex.
Summary
Thesis: Ethereum Value Is Cheap for a Reason — But the Market Is Close to Oversold Exhaustion
Ethereum (ETHUSDT) is trading around $1,930, sitting well below all key daily moving averages in a market dominated by Bitcoin at ~56% dominance and a crypto-wide sentiment of Extreme Fear (index at 9). That combination usually means Ethereum value looks optically cheap, but buyers are still too scared to step in size.
The dominant force right now is risk-off positioning: capital is hiding in BTC and stables while growth assets like ETH trade at a discount. The question is not “is ETH undervalued?” in the long-term sense, but rather: is the current downtrend mature enough to justify taking the other side? On the daily chart, the structure is still bearish, but momentum and volatility suggest we may be entering the late phase of the selloff rather than the middle.
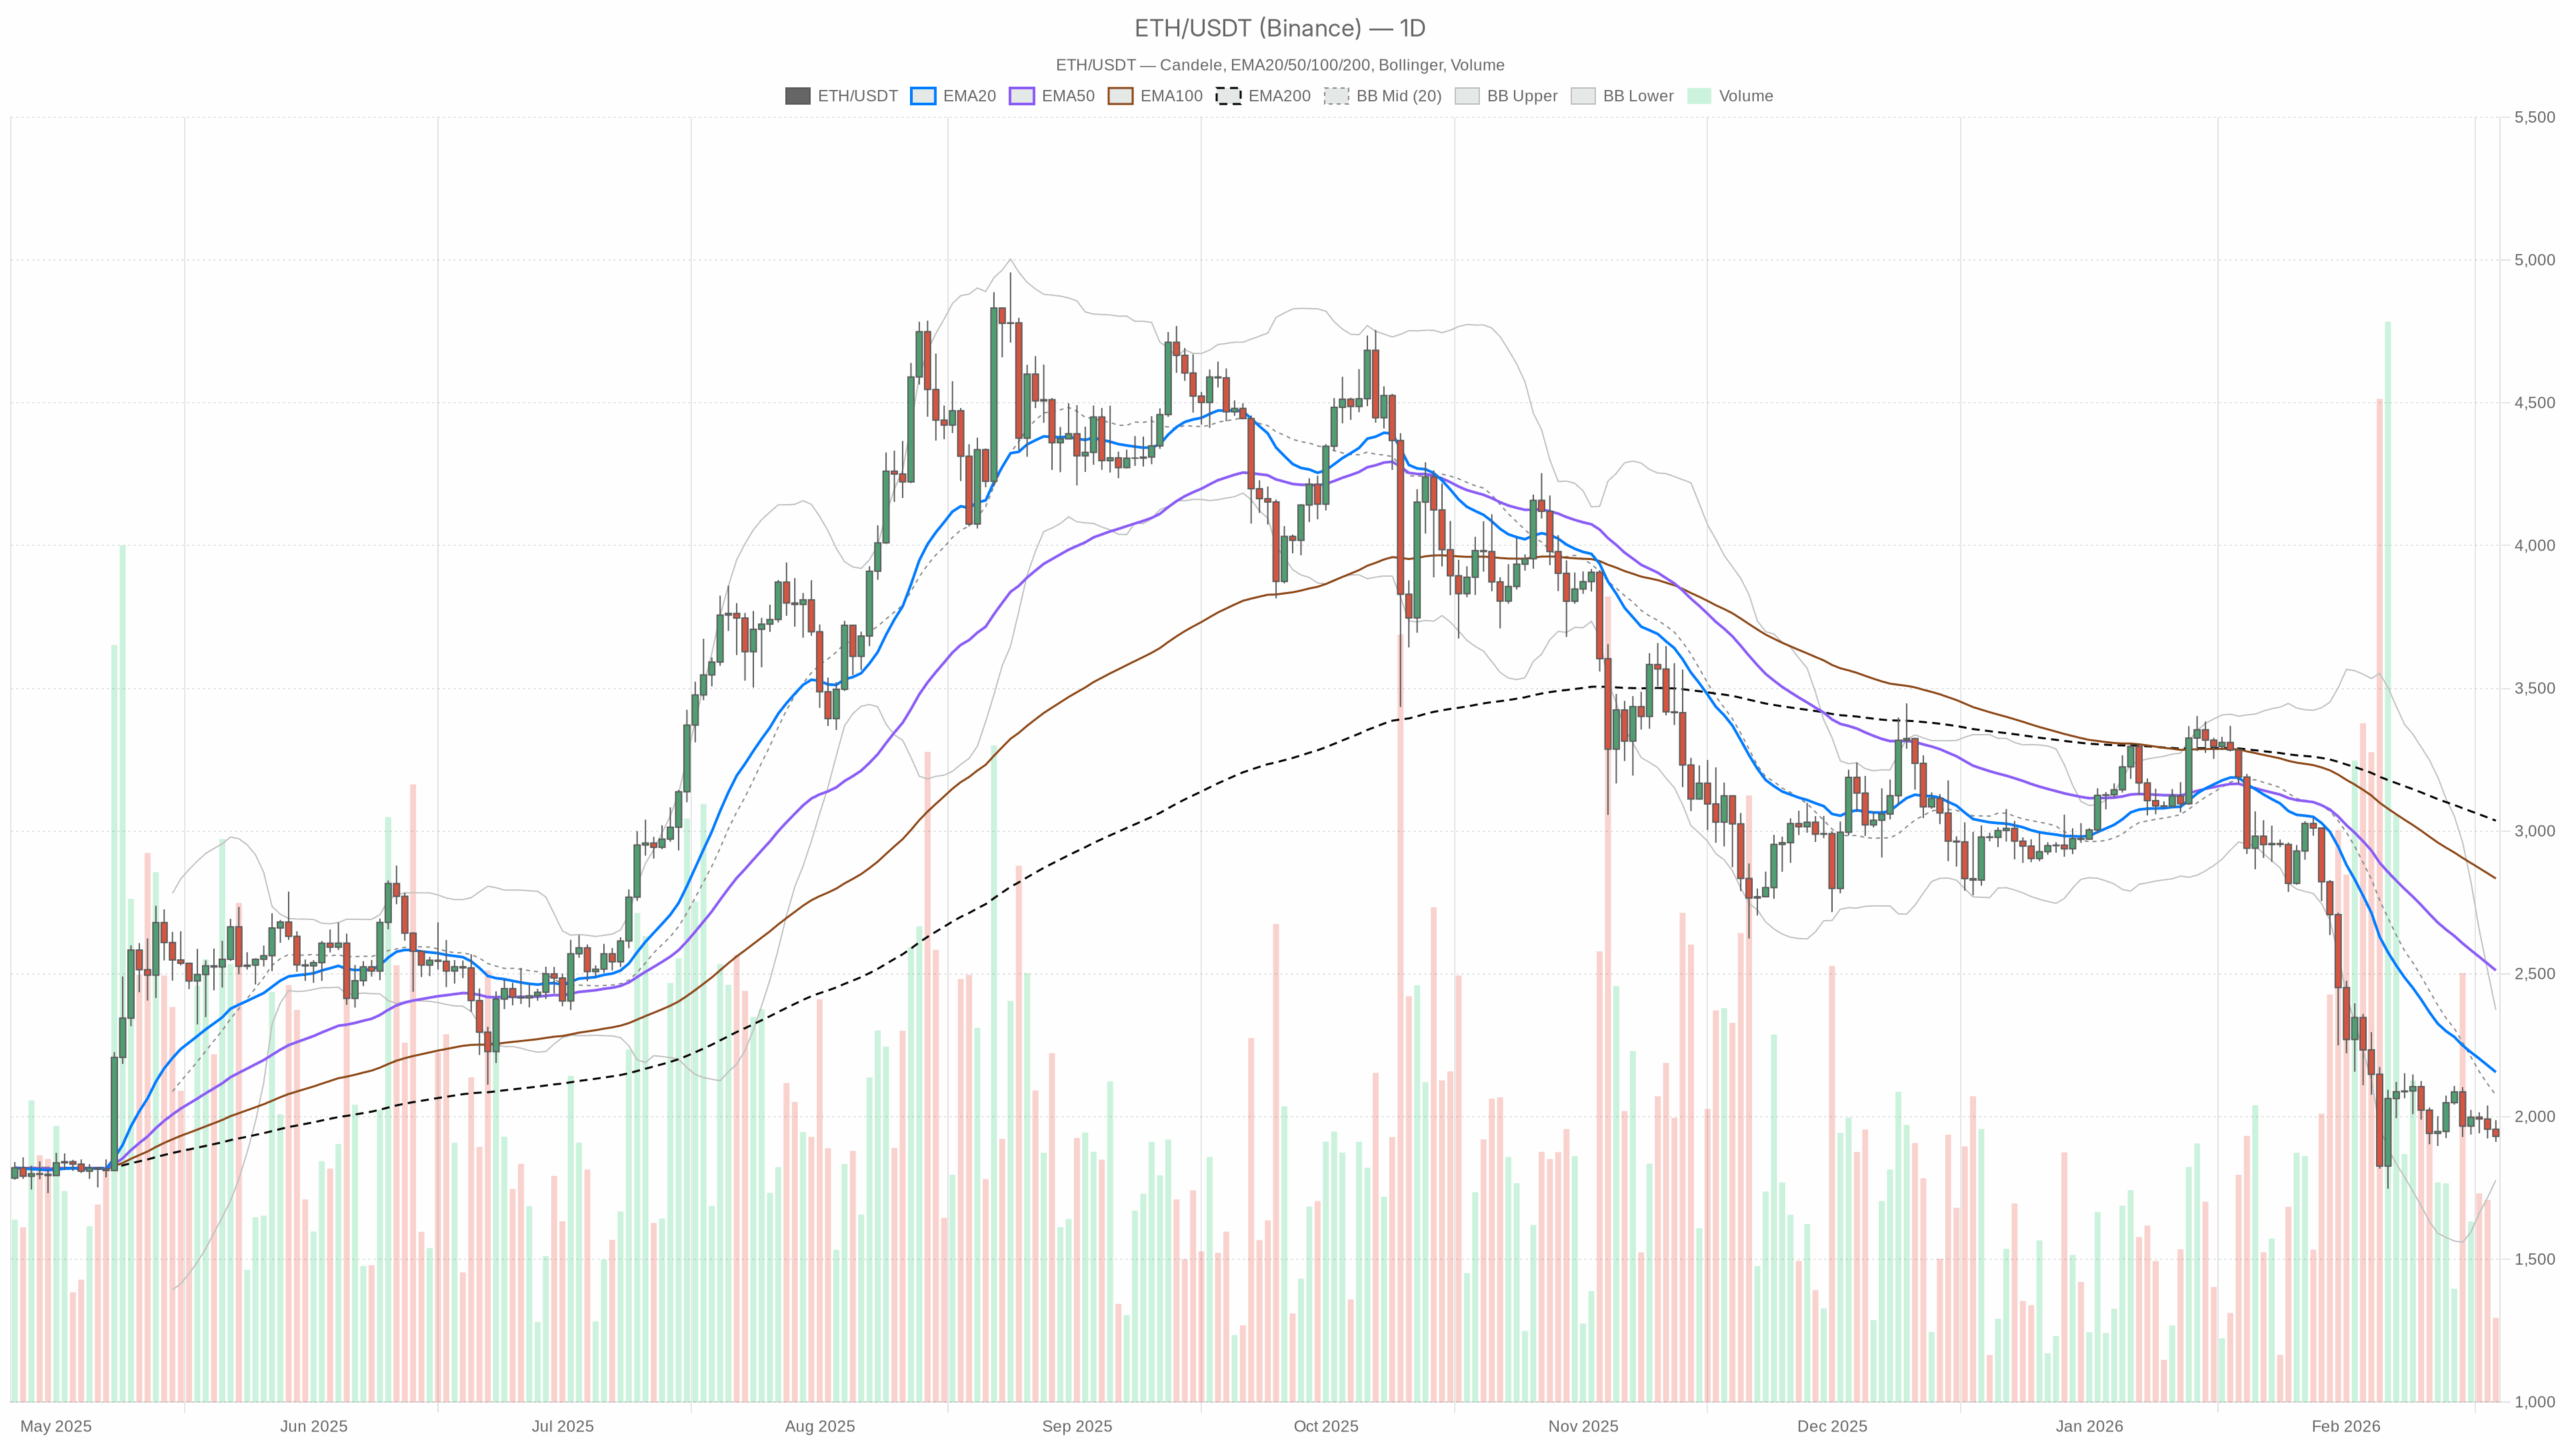
Daily Chart (D1): Macro Bias – Bearish, But Late in the Move
On the daily timeframe, ETH/USDT is clearly in a bearing regime. Price is below all major EMAs and trades in the lower half of its Bollinger Band range.
Trend Structure: EMAs
Daily close: $1,930.61
EMA 20: $2,155.87
EMA 50: $2,512.20
EMA 200: $3,036.68
ETH is trading roughly 10% below the 20-day, 23% below the 50-day, and a massive 36% below the 200-day EMA. The short-, medium-, and long-term trend lines are all stacked above price and pointing down.
Interpretation: This is a textbook downtrend. Ethereum value is cheap versus where it traded over the past few months, but it is cheap within a trend, not in a vacuum. Any bounce back toward the 20-day EMA near $2,150 currently looks more like a rally into resistance than a full trend reversal.
Momentum: RSI (14)
RSI (14): 32.56
RSI is hovering just above the classic oversold line without actually breaking below 30.
Interpretation: Sellers are clearly in control, but we are not at capitulation levels yet. This is the zone where continued grind lower is still possible, but it also does not take much additional selling to trigger genuine oversold conditions and spark short-covering. Momentum is bearish, but it is no longer early; it is in the late, heavy phase of the move.
Momentum & Trend Confirmation: MACD
MACD line: -209.59
Signal line: -231.10
Histogram: +21.50
The MACD is deeply negative, confirming the strength and duration of the downtrend. However, the MACD line has crossed above the signal line, turning the histogram slightly positive.
Interpretation: The trend is still down, but downside momentum is slowing. This is often what you see when a selloff is transitioning from acceleration to consolidation or a potential base. MACD is not giving a clean buy signal yet, but it does say the worst of the momentum may be behind us, even if price has not found a firm floor.
Volatility & Positioning: Bollinger Bands
BB mid (20 SMA proxy): $2,075.66
Upper band: $2,373.98
Lower band: $1,777.35
Price vs bands: $1,930 is below the midline, above the lower band.
ETH is trading in the lower half of the band range, closer to the lower band but not hugging it.
Interpretation: The market has already priced in a significant amount of downside, but we are not in an outright panic where price rides the lower band. That usually means the move is more of a controlled de-risking than a liquidation spiral. A retest of the lower band near $1,780 remains on the table if fear intensifies, but the current spot is more weak, but not breaking than freefall.
Volatility & Risk: ATR (14)
ATR (14): $129.21
With ETH at about $1,930, a daily ATR of roughly $129 implies typical daily swings of about 6.5% of price.
Interpretation: Volatility is elevated but not at crisis levels. For traders, it means risk per position is high: stops need more room, and leverage has to be dialed down. For longer-term investors watching perceived Ethereum value, it means short-term noise is large enough that entries will rarely be perfect; you have to be comfortable with $100+ swings even if you are directionally right.
Near-Term Map: Daily Pivot Levels
Pivot (PP): $1,943.22
Resistance 1 (R1): $1,974.94
Support 1 (S1): $1,898.88
Price is trading just below the daily pivot and just above S1.
Interpretation: The intraday balance is slightly negative: the market is leaning under the pivot, but not convincingly breaking support. A clean daily close back above $1,975 would be the first sign that dip-buyers are finally stepping in; a break and hold below $1,900 ramps up the risk of a deeper slide toward the lower Bollinger Band.
Hourly Chart (H1): Short-Term Pressure, Controlled Selling
On the 1-hour chart, ETH is also in a bearish regime, but some signals show compression rather than acceleration.
Trend on H1: EMAs
H1 close: $1,931.95
EMA 20: $1,958.45
EMA 50: $1,970.43
EMA 200: $1,998.02
Price is below all three hourly EMAs, but the distance to them is relatively modest, at about 1–3%.
Interpretation: The short-term trend is still down, but the move is not extended on this timeframe. Bears are in control, yet the market is not heavily stretched intraday. That often leads to choppy, mean-reverting bounces into the EMAs, which then act as resistance.
Hourly RSI & MACD
RSI (14, H1): 35.82
MACD (H1): line -9.38, signal -5.86, histogram -3.52
Hourly RSI is under 40, confirming bearish momentum, while MACD is negative with the histogram also negative.
Interpretation: Unlike the daily MACD, the hourly MACD has not yet turned. Short-term momentum is still drifting lower. This supports the idea that intraday rallies are likely to be sold until we see positive divergence or a flip in the histogram.
Hourly Bollinger Bands, ATR & Pivots
BB mid: $1,956.97
BB upper: $1,989.27
BB lower: $1,924.68
ATR (14, H1): $15.41
H1 Pivot (PP): $1,926.62
R1: $1,941.18
S1: $1,917.40
Price is hovering just above the lower hourly band and just above the hourly pivot.
Interpretation: Intraday, ETH is heavy near the lower bands but not breaking down. Volatility around $15 per hour is meaningful but manageable. As long as price holds above $1,917–1,925, short-term sellers are pressing but not dominating; a break below that zone would likely invite a quick slide to test deeper supports.
15-Minute Chart (M15): Execution Context – Micro Downtrend, No Clear Reversal Yet
The 15-minute chart is purely for timing. It mirrors the higher timeframes with a smaller lens.
M15 close: $1,932.26
EMA 20: $1,944.61
EMA 50: $1,956.40
EMA 200: $1,970.96
RSI (14, M15): 36.65
MACD (M15): line -11.13, signal -9.11, histogram -2.02
BB mid: $1,947.85
BB upper: $1,978.96
BB lower: $1,916.74
ATR (14, M15): $10.56
Pivot (PP, M15): $1,926.73 (R1: $1,941.38, S1: $1,917.60)
Price is sitting just above the 15-minute pivot and the lower band area; momentum is bearish but not collapsing.
Interpretation: The micro trend points down, but price action is in a zone where scalpers may start fading further weakness, especially if higher timeframes hold their nearby supports. Any aggressive bounce from $1,920–1,930 that reclaims $1,950–1,960 on M15 would be an early tell that short-term selling is finally tiring.
Market Context: Ethereum Value vs. Macro Crypto Flows
The broader market cap has slipped about 1.8% in 24 hours, and sentiment is pinned at Extreme Fear. BTC dominance above 56% while Ethereum holds under 10% market share is a classic risk-off alignment: the market is rewarding perceived safety in BTC and stablecoins while systematically underweighting ETH and the rest of the risk curve.
On the fundamental side, DeFi activity is mixed. Uniswap V3 fees spiked over 400% in the last day, though seven-day fees are down. That hints at episodic bursts of on-chain activity, likely volatility or rotation trades, rather than a steady growth trend. For Ethereum value, that is a double-edged sword: the network is clearly still used, but the flows do not yet show a definitive, sustained return of risk appetite.
A notable headline is Harvard reportedly rotating from Bitcoin into Ethereum. One institution does not define price, but it underscores a long-running theme: on longer horizons, large players are willing to treat ETH as a core asset rather than a speculative token. In the short term, however, that kind of news is being drowned out by macro de-risking.
Main Scenario Based on D1: Moderately Bearish With a Late-Stage Feel
Taking the daily chart as the anchor, several elements align. The trend based on EMAs is firmly bearish. RSI is weak but not yet washed out. MACD is still negative but starting to improve. Price is in the lower half of the Bollinger range, not pinned to the bottom. Volatility is elevated but not extreme.
Put together, the base case is bearish, with a strong chance we are closer to the later innings of the downtrend than the beginning. The market is still pricing Ethereum value defensively, but signs of momentum fatigue are creeping in.
Scenarios for ETH/USDT
1. Bullish Scenario: Oversold Rebound and Mean Reversion
In the bullish path, the current area around $1,900–1,930 acts as a higher-timeframe support pocket, and extreme fear finally starts to attract contrarian buyers.
Key ingredients:
- Support holds: Daily price defends the $1,900 zone (S1) and avoids a clean break of the lower Bollinger band near $1,780.
- Momentum flip: Daily RSI stabilizes and curls back above 40, while MACD histogram continues to grow positive, confirming that downside momentum has truly peaked.
- Short-term reclaim: On H1 and M15, ETH reclaims and holds above the 20 and 50 EMAs, roughly $1,960–1,980. These start acting as support rather than resistance.
Targets in this bullish mean-reversion scenario:
- First, a move back to the daily pivot/R1 cluster around $1,975–2,000.
- Then a test of the daily mid-Bollinger and 20 EMA zone around $2,075–2,150.
If risk appetite returns more broadly and BTC dominance cools, a deeper retrace toward the 50-day EMA, currently about $2,500, becomes possible, but that is a second-stage move, not the first expectation.
What invalidates the bullish scenario?
- A decisive daily close below $1,900 followed by continuation toward $1,800.
- Daily RSI sliding into deep oversold, under 30, with price hugging the lower Bollinger band, which would signal we are not done with the liquidation phase.
2. Bearish Scenario: Continuation Into a Deeper Value Reset
The bearish path says the current pause is just a rest stop in a larger downtrend. Extreme fear does not convert into buying; instead, it reflects real forced selling or macro risk-off that still has legs.
Key ingredients:
- Pivot failure: ETH loses the $1,900–1,910 support band on a daily closing basis.
- Momentum re-accelerates: Daily MACD histogram stalls or turns back down, and RSI breaks below 30 without an immediate rebound.
- Band walk: Price starts trading consistently near or below the lower Bollinger band, indicating sustained selling pressure.
In that case, the next logical area is a full test of the lower band region around $1,780. If that fails, markets will start repricing Ethereum value based not on recent trading ranges but on earlier structural supports, which could be significantly lower than current levels.
What invalidates the bearish scenario?
- A strong push that closes the day above $2,000, takes out R1, and holds above the daily pivot for multiple sessions.
- H1 and D1 both flipping into a pattern where price rides above the 20 EMA instead of below it, showing a genuine change of control from sellers to buyers.
Positioning, Risk, and How to Think About Ethereum Value Here
This is a trend-down, late-phase environment with elevated volatility and extreme fear. That combination tends to punish both extremes: dip buyers who ignore the prevailing trend and scale in aggressively too early, and late shorts who chase breakdowns after volatility has already expanded.
For traders, the key is acknowledging that the daily trend is still down. Any long attempts are, for now, counter-trend and need tight invalidation levels around the nearby supports, with $1,900 first, then the lower band near $1,780. Short setups should respect the fact that momentum has already done a lot of work; this is not the time for blind, highly leveraged continuation bets without clear levels.
For investors thinking in terms of Ethereum value rather than just price ticks, the current zone is the start of the territory where fear can create opportunity, but the tape does not yet show a confirmed bottom. That means sizing and patience matter more than precision. The market is still willing to discount ETH in favor of BTC and stables; until that changes on the charts, every bounce is suspect.
The only certainty here is uncertainty. Volatility is high, macro risk sentiment is fragile, and the tape is still trending down. Any plan, bullish or bearish, needs clear levels where you admit you are wrong and step aside, rather than trying to fight a market that has already made up its mind for the day.