

Markets remain risk-off as traders reassess Ripple XRP value within a damaged trend, even while intraday charts attempt a cautious rebound from recent lows.
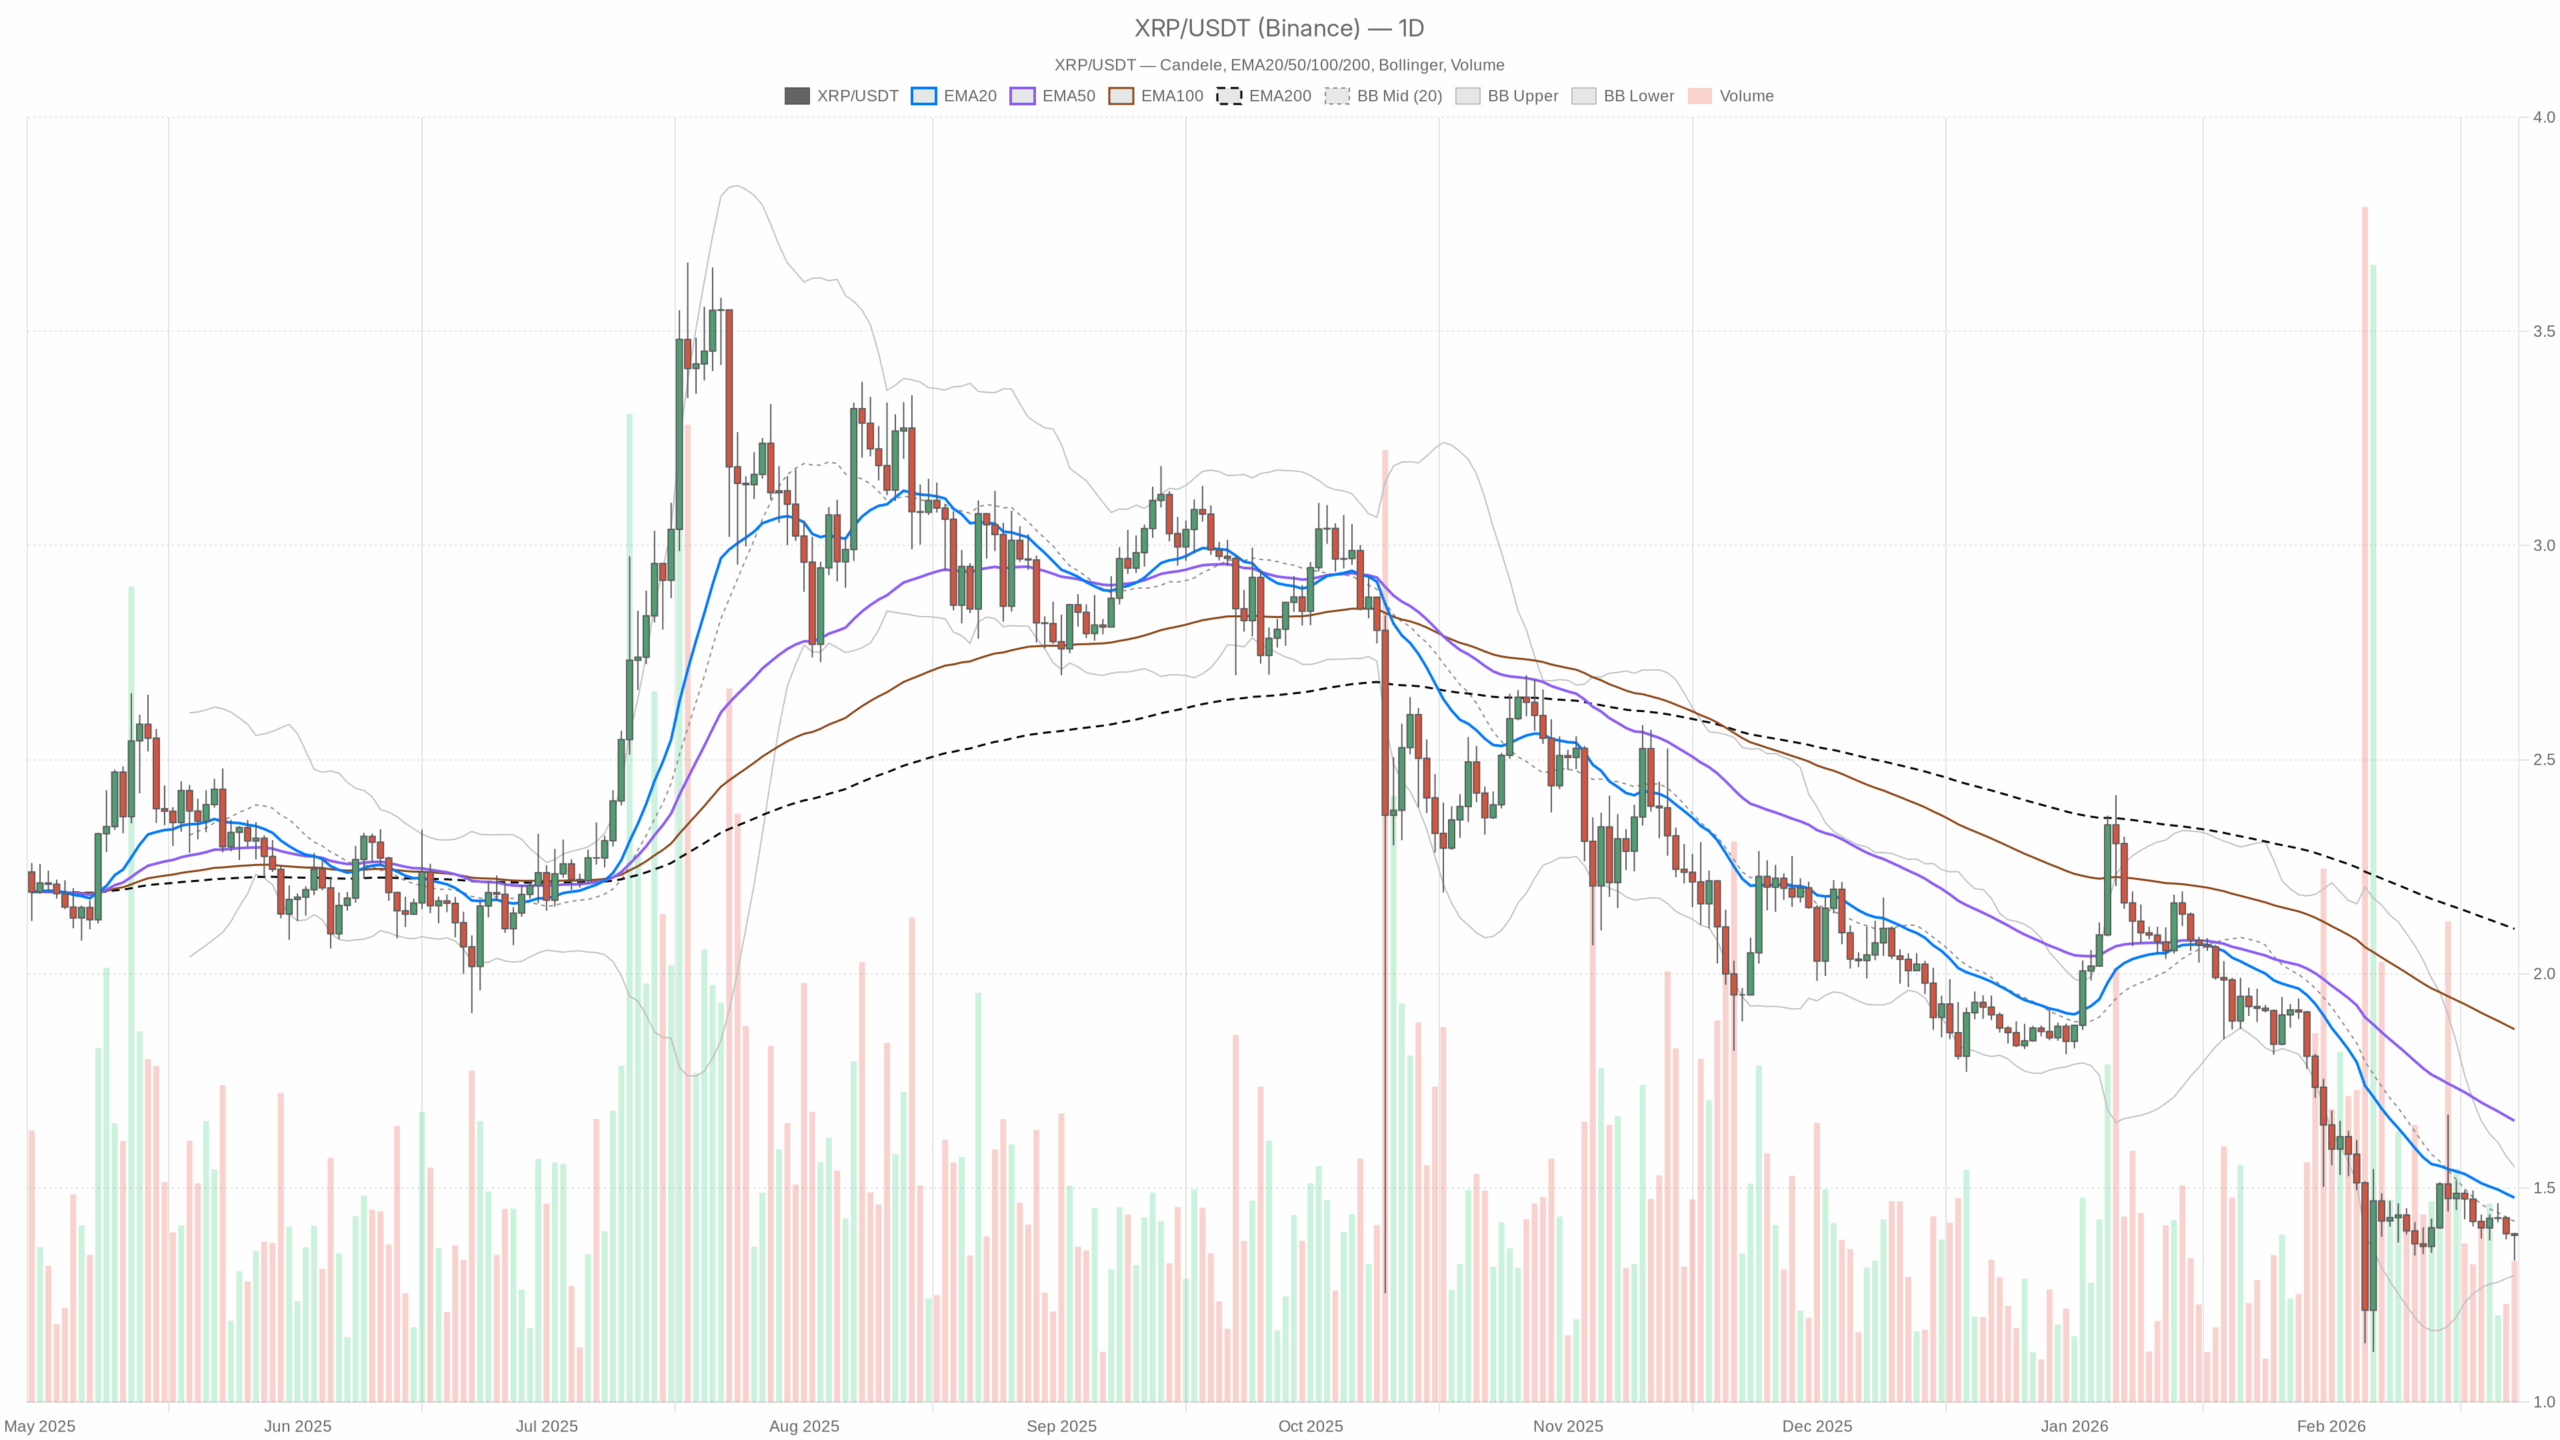 EMA20, EMA50 and volume”
loading=”lazy” />
Summary
Ripple XRP value – where we really are on XRPUSDT
XRPUSDT is trading around 1.39 with the daily trend clearly damaged and still pointing down. Price sits below all key daily EMAs and under the Bollinger midline, while broader crypto market cap is down about 2.4% and the Fear & Greed index is stuck in Extreme Fear (5). In other words, the environment is risk-off, and XRP is trading on the defensive.
What makes this moment important is the growing tension between timeframes. The daily chart is bearish, but the 1-hour and 15-minute charts are trying to bounce. That usually means we are in a bear-market rally or, at best, early repair after a selloff. The key question for the next sessions is simple: does this bounce get sold, or can bulls drag XRP back into a higher range and start repairing structure?
With BTC dominance above 56% and global liquidity cautious, XRP’s upside is still fighting macro headwinds. Moreover, short-term traders can work the intraday long side, but higher timeframe players should treat this as a counter-trend move until the daily chart actually proves otherwise.
Main scenario based on the daily (D1): Bearish
Daily (D1) defines the bias, and here it is straightforward:
- Price is below the 20, 50, and 200-day EMAs.
- Daily RSI is weak but not yet washed-out.
- MACD is negative, though it is trying to curl.
That is a bearish regime with a modest attempt to stabilize. Any bounce is guilty until proven innocent.
Daily timeframe (D1) – structure and risk backdrop
Price & EMAs
– Close: 1.39
– EMA 20: 1.48
– EMA 50: 1.66
– EMA 200: 2.11
All three EMAs are sitting above spot price, with the 20 < 50 < 200, a classic bearish alignment. That tells you the trend has been down for a while, not just a one-day dip. Being this far under the 200-day (around 2.11) shows XRP is in a long-term downtrend relative to its prior cycle levels.
What it implies: The path of least resistance remains lower. Rallies into the 1.48–1.66 zone are more likely to meet selling than clean trend continuation higher, unless bulls can reclaim and hold above the 20-day first.
RSI (14)
– RSI: 37.64
RSI is below 40, so momentum is weak but not fully oversold. Bears are still in control of the tape, but the market is not in a blind panic. There is room for a further leg down before hitting true capitulation levels.
What it implies: Sellers have the upper hand, yet this is not a stretched extreme. It favors a grindy, controlled downtrend or choppy basing more than a dramatic V-shaped reversal right here.
MACD
– MACD line: -0.08
– Signal line: -0.10
– Histogram: +0.02
MACD is still in negative territory, confirming the broader downtrend. However, the MACD line is slightly above the signal, giving a small positive histogram. That is an early sign that downside momentum has eased and a counter-trend bounce is underway or forming.
What it implies: Sellers are losing some pressure, but this is still a bounce within a downtrend, not a confirmed trend reversal. Bulls need several more strong daily candles to flip this structure.
Bollinger Bands (20, 2)
– Mid-band: 1.42
– Upper band: 1.55
– Lower band: 1.30
– Price vs bands: Close at 1.39, just below the mid-band
Price is trading just under the mid-band after having been pressured toward the lower band. This usually reflects a stabilizing phase following weakness: bears stopped pushing price at the extremes, but buyers have not yet reclaimed the upper half of the range.
What it implies: As long as XRP stays below the mid-band (around 1.42), the bounce is timid. A daily close above 1.42 would be the first sign bulls are not just covering shorts but actively pushing for a broader recovery toward the upper band near 1.55.
ATR (14) – volatility
– ATR: 0.08
Daily ATR around 0.08 on a 1.39 asset points to moderate but not explosive volatility. Moves of about 5–6% per day are normal in this environment.
What it implies: Swings are meaningful but not chaotic. You cannot ignore risk, but we are not in a full volatility spike where levels become meaningless intraday.
Daily Pivot Levels
– Pivot point (PP): 1.37
– Resistance 1 (R1): 1.41
– Support 1 (S1): 1.35
Price at 1.39 is sitting above the daily pivot, below R1 and above S1. That puts XRP in the upper half of today’s calculated range but still under short-term resistance.
What it implies: Intraday tone on the daily framework is slightly constructive, but 1.41 acts as the first real ceiling. Losing 1.37–1.35 would confirm that the bears are re-asserting control after a shallow bounce.
1-hour timeframe (H1) – the bounce trying to organize
On H1, the tone is noticeably less bearish than the daily.
Price & EMAs
– Close: 1.39
– EMA 20: 1.38
– EMA 50: 1.40
– EMA 200: 1.42
– Regime: Neutral
Price is slightly above the 20-EMA, just under the 50-EMA and below the 200-EMA. That is a short-term neutral / early-recovery setup inside a larger downtrend. The fast EMA is supporting, but the slower EMAs still cap the move.
What it implies: Intraday buyers have some control, but they have not flipped the trend. The zone between 1.40 and 1.42 is where short-term bulls will run into stronger selling pressure.
RSI (14)
– RSI: 53.21
Momentum on the hourly chart is slightly positive, just above neutral.
What it implies: Short-term buyers are active, but there is no blow-off or exhaustion. This fits with a controlled, cautious bounce rather than aggressive chasing.
MACD
– MACD line: -0.01
– Signal: -0.02
– Histogram: 0
MACD is hovering around the zero line with almost no histogram.
What it implies: Intraday momentum is balanced. The market is waiting for a new impulse, either a clean push through resistance or a rejection back into the daily downtrend.
Bollinger Bands
– Mid-band: 1.37
– Upper band: 1.42
– Lower band: 1.33
– Price vs bands: Close at 1.39, above the mid-band
XRP trades in the upper half of the hourly band structure.
What it implies: Short-term control leans to the buy side. If price rides the upper band toward 1.42 and holds, the bounce can extend. However, if it fails there and sinks back to the mid-band, it supports the view of a fading rally.
ATR (14)
– ATR: 0.02
Intra-hour swings of roughly 1.5% are normal right now.
What it implies: The tape is tradable without being unmanageable, but stops that are too tight around local levels can still get clipped easily.
Hourly Pivot Levels
– Pivot point (PP): 1.38
– Resistance 1 (R1): 1.40
– Support 1 (S1): 1.37
Price is just above the hourly pivot and below R1.
What it implies: Very short-term sentiment is constructive, but 1.40 is the first level intraday bulls need to clear decisively. A drop back below 1.38 would show that buyers are losing grip on this bounce.
15-minute timeframe (M15) – execution zone, not the big story
The 15-minute chart is only relevant for timing entries and exits, but it tells you how stretched the current micro-move is.
Price & EMAs
– Close: 1.39
– EMA 20: 1.37
– EMA 50: 1.37
– EMA 200: 1.40
– Regime: Neutral
Price is above the fast 20 and 50 EMAs, but just under the 200 EMA.
What it implies: Micro-trend is up within a still-capped structure. It is the textbook look of a short-term rally running into higher-timeframe resistance.
RSI (14)
– RSI: 68.63
Short-term RSI is pushing into overbought territory.
What it implies: The current leg of the bounce is getting stretched on a very short timeframe. It does not mean a top on the daily, but it does argue against chasing fresh longs without a pullback.
MACD
– MACD line: 0.01
– Signal: 0
– Histogram: 0
MACD is slightly positive but flat.
What it implies: Upward intraday momentum exists, but it is not a runaway move. If price stalls near the 200 EMA on M15, a short-term consolidation or dip would be normal.
Bollinger Bands
– Mid-band: 1.36
– Upper band: 1.39
– Lower band: 1.34
– Price vs bands: Close at 1.39, right at the upper band
Price is hugging the upper band on the 15-minute chart.
What it implies: Short-term buyers are in control, but this is exactly where you start to look for either continuation with strong volume or a quick mean-reversion dip back toward 1.36.
ATR (14)
– ATR: 0.01
Micro volatility is present but contained.
What it implies: Very short-term swings of around 1% are normal. For scalpers, that is tradable; for higher-timeframe traders, it is mostly noise.
15-minute Pivot Levels
– Pivot point (PP): 1.39
– Resistance 1 (R1): 1.39
– Support 1 (S1): 1.39
All pivots have essentially converged at the current price, a sign of a very tight recent range.
What it implies: The market is coiling on the micro timeframe. A break away from 1.39 is likely to move quickly for a few candles once it chooses direction.
Putting it all together – XRP’s conflicting signals
Daily: Bearish structure, under all major EMAs, weak RSI, negative MACD but trying to stabilize.
Hourly: Neutral, mild bullish bias; price above fast EMA but under 200-EMA; RSI slightly positive.
15-minute: Short-term bounce, momentum stretched, sitting at local resistance.
There is an explicit tension between timeframes: the larger trend is still down, while lower timeframes are working a rebound. In this context, the most likely pattern is either:
- A bear-market rally into the 1.41–1.55 band that eventually gets sold, or
- A slow basing process where XRP chops sideways, gradually digesting prior losses before any serious trend change.
The broader market is not helping the bullish case. BTC dominance is high, total crypto market cap is shrinking, and sentiment is in extreme fear. Those conditions historically favor defensive positioning and selectively shorting rallies rather than chasing altcoin breakouts.
Key bullish scenario for Ripple XRP value
For a credible bullish case, XRP needs to turn this short-term bounce into genuine structure repair.
What bulls want to see:
1. Hold above 1.37–1.35
This pivot/S1 area on the daily is the immediate line in the sand. As long as price stays above it, the current bounce structure remains intact.
2. Daily close above 1.42
That would put price back above the daily Bollinger mid-band and solidly above today’s pivot, signaling buyers can hold gains. It would also push the hourly chart into a cleaner up-bias.
3. Follow-through toward 1.48–1.55
– 1.48: daily 20-EMA, first real trend test.
– 1.55: upper Bollinger band on D1.
A move into this zone with daily RSI lifting into the mid-40s and MACD histogram expanding on the positive side would confirm that this is not just short covering.
4. Later, a reclaim of the 50-day EMA (around 1.66)
That is where the medium-term narrative finally starts to change from “bounce in a downtrend” to “possible new uptrend”. We are not there yet.
What would invalidate the bullish scenario:
A decisive close below 1.35 on the daily would break the current support band, likely drag RSI closer to oversold, and show that sellers are still dictating direction.
Moreover, failure to hold above the 1-hour 20-EMA on subsequent dips (currently around 1.38) would be a problem. Repeated rejection under 1.40–1.42 while macro sentiment stays fearful would tilt the odds back toward continuation of the downtrend.
Key bearish scenario for Ripple XRP value
The bears already have the higher-timeframe trend on their side; their job is to prevent this bounce from turning into something bigger.
What bears want to see:
1. Rejection in the 1.40–1.42 band
This area aligns with hourly R1 and the upper Bollinger on H1. A rejection here, especially if M15 RSI rolls over from overbought, would favor another leg down.
2. Break and daily close below 1.35
That is the key nearby support. Losing it likely opens a path back toward the lower daily Bollinger band near 1.30 and potentially lower.
3. Daily RSI slipping toward 30 with MACD turning more negative again
That would indicate that the brief easing in downside momentum is over and the downtrend is re-accelerating.
4. Failure to reclaim the 20-day EMA (1.48) on any rallies
As long as price gets capped beneath 1.48 on a daily closing basis, the broader narrative remains bearish.
What would invalidate the bearish scenario:
A strong daily close above 1.48 backed by rising volume and a sustained positive MACD histogram would show that sellers have lost control of the short-term trend.
Subsequent acceptance above 1.55 (upper daily Bollinger) and a sustained move where dips hold above 1.42–1.48 would be important. That behavior would look more like early trend reversal than a simple relief rally.
Positioning, risk and uncertainty
Right now, Ripple’s XRP value sits in an awkward middle ground: too weak to call a bottom, too stretched on lower timeframes to chase aggressively. The daily chart is still firmly bearish, and the market backdrop is risk-averse. The lower timeframes only tell you that the selloff is pausing, not that it is over.
For traders, the logic is straightforward:
- The dominant force is the daily downtrend and macro fear.
- The counter-force is a modest intraday bounce with overbought conditions on M15.
That combination usually rewards patience and respect for levels. Key reference zones are:
- Support: 1.37–1.35 first, then 1.30 if that breaks.
- Resistance: 1.40–1.42 intraday, then 1.48–1.55 on the daily.
Volatility is meaningful but not extreme, so both long and short trades can work, provided they are sized with the understanding that 5–6% daily swings are ordinary here. Nothing in these numbers guarantees direction; all they say is that the burden of proof is on the bulls to change a still-bearish higher-timeframe trend.
In short, the main scenario for XRPUSDT remains bearish on the daily, with a live but unproven bounce on lower timeframes. Until XRP can reclaim and hold above the 1.42 then 1.48 bands, Ripple XRP value is better described as recovering inside a downtrend than starting a new bull leg.