

Market conditions remain fragile, with Ethereum crypto today trading in a controlled downtrend while broader sentiment stays extremely fearful across the digital asset space.
Summary
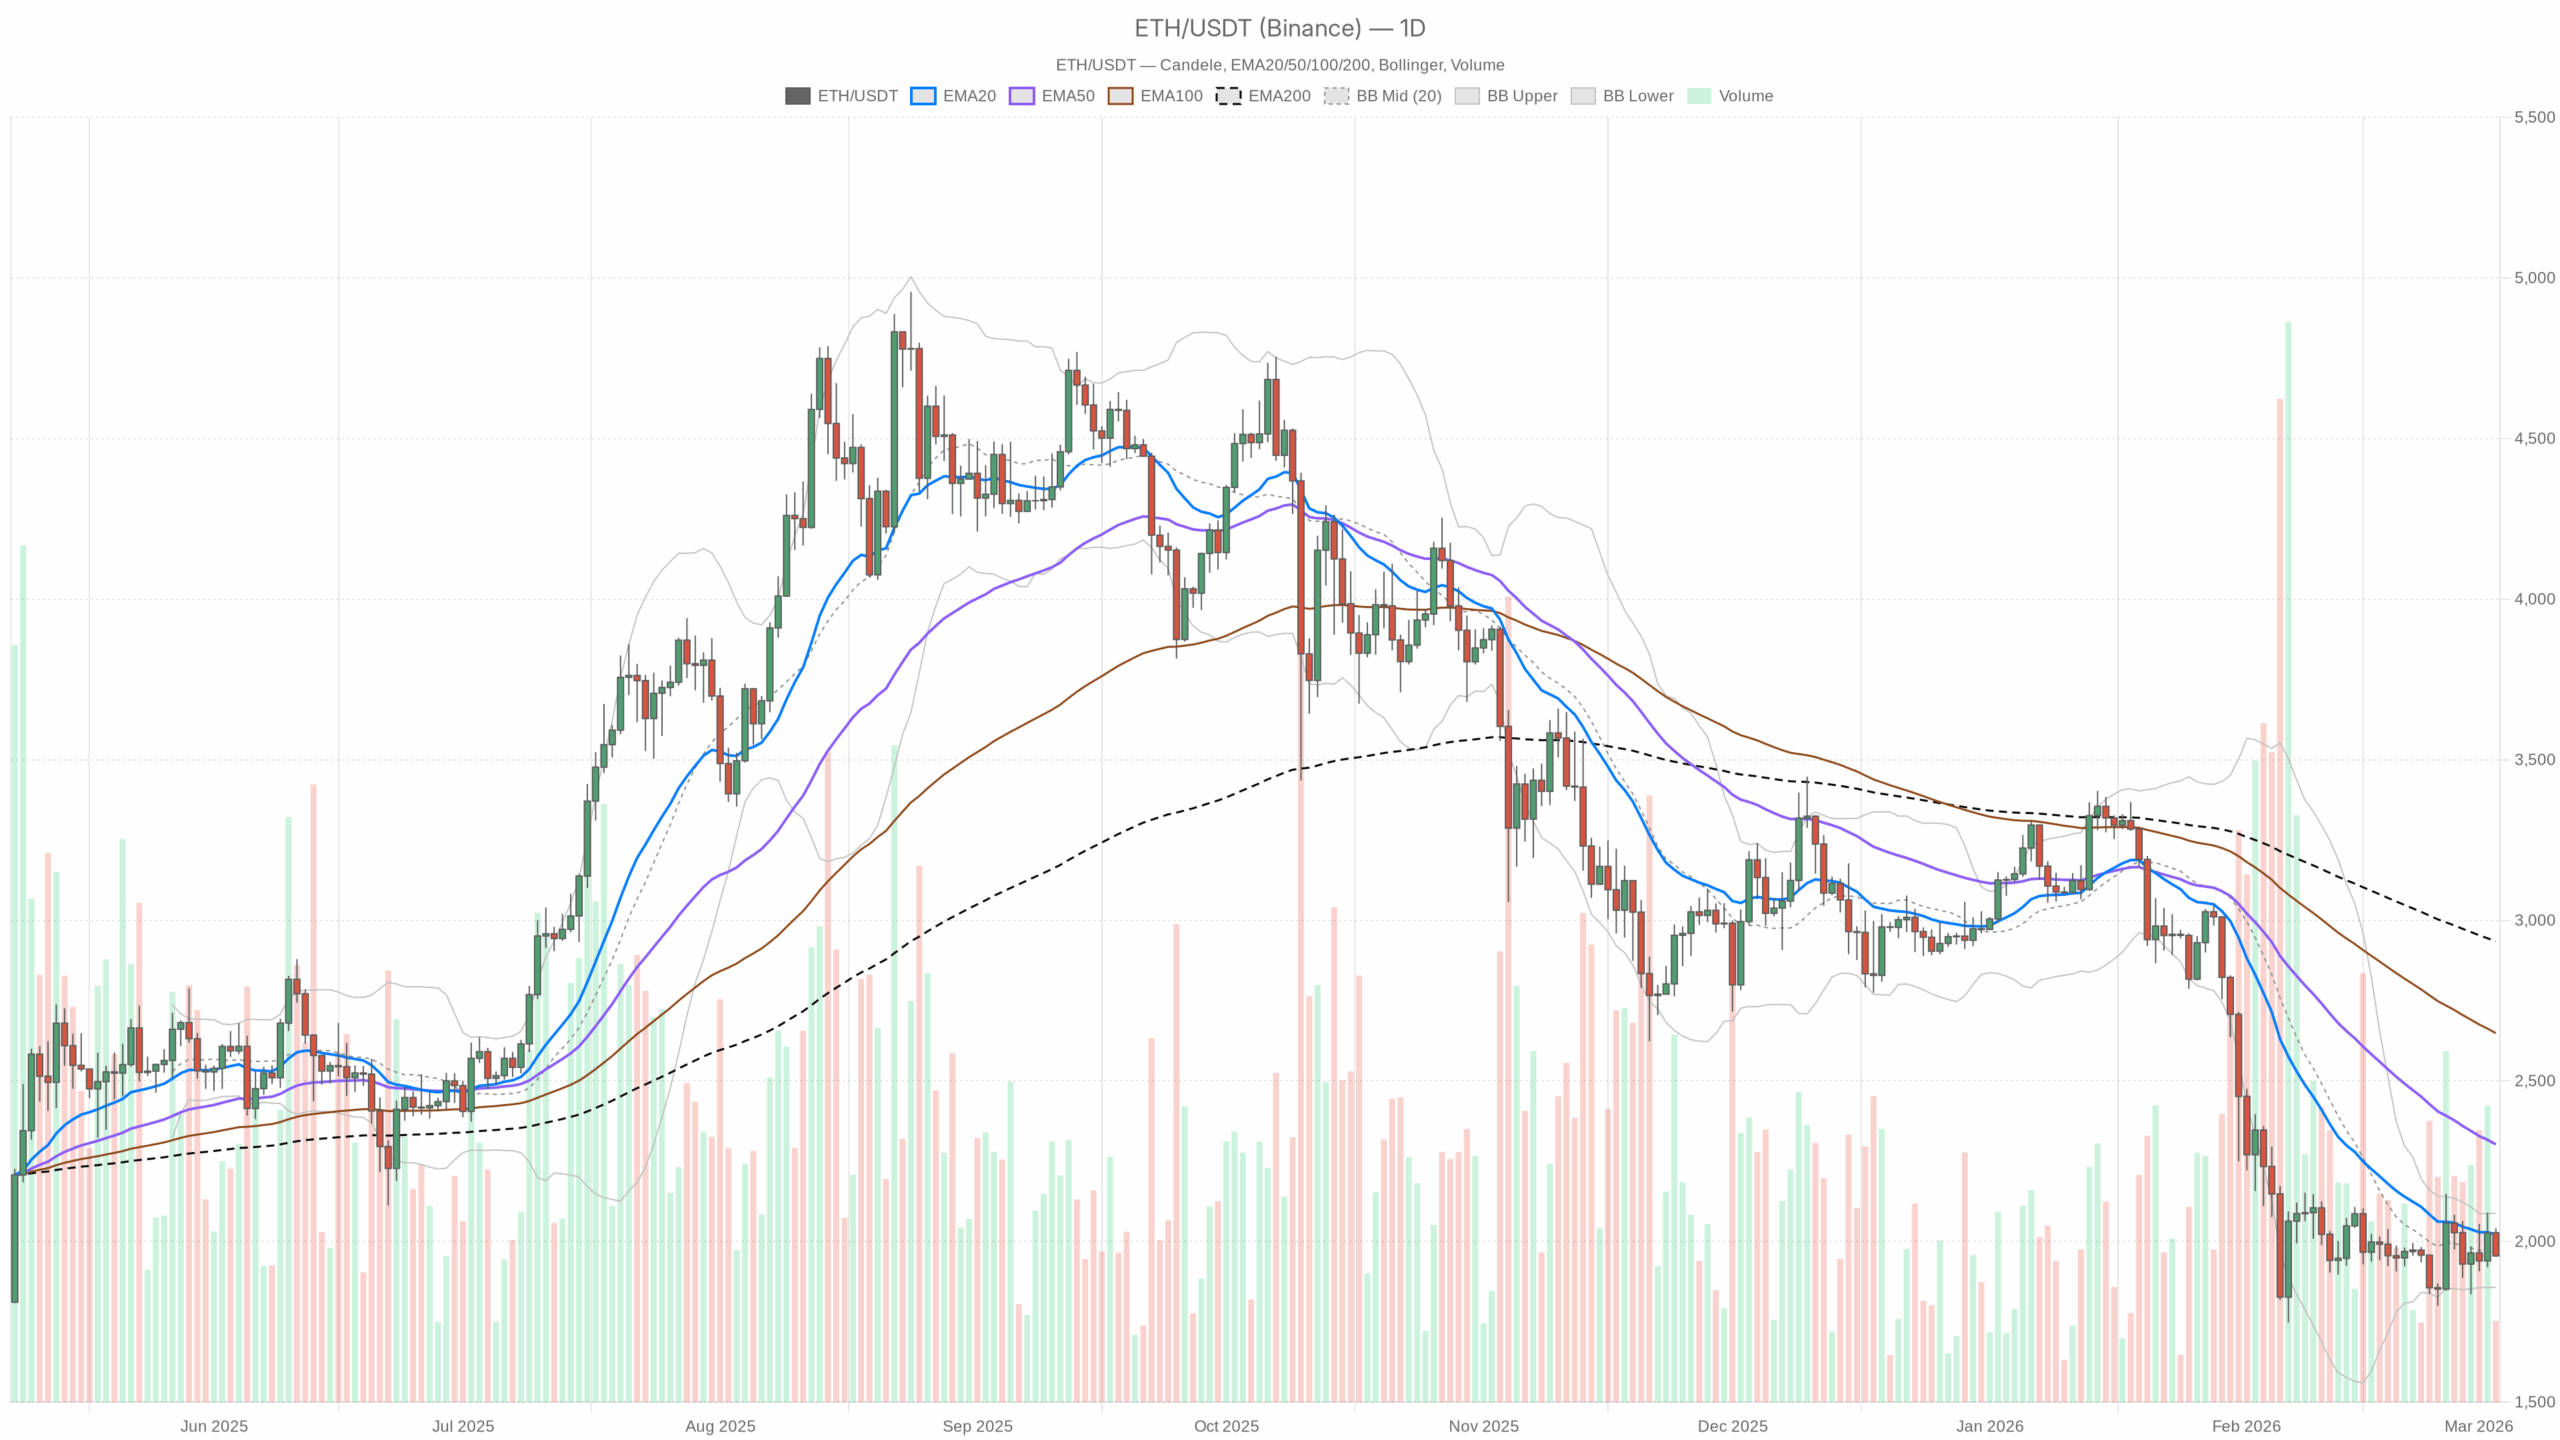
Ethereum crypto today: a heavy market, but not yet in capitulation
Ethereum against USDT is trading around $1,955, stuck under every major daily moving average and below the $2,000 psychological mark. The broader crypto market is stabilizing after a downtrend, but sentiment is still toxic: the fear & greed index sits in Extreme Fear (14), and Bitcoin dominance above 56% confirms capital is hiding in BTC rather than rotating into ETH or the rest of the alt market.
In other words, this is still a bears-in-control environment on higher timeframes. The question now is whether ETH is quietly building a base around $1,900–2,000 for a later mean reversion bounce, or whether this is just a pause before another leg lower.
On balance, the primary scenario from the daily chart is bearish: ETH is in a downtrend with fading downside momentum but no confirmed bullish structure yet.
Daily chart (D1): dominant bias – controlled downtrend, no base yet
Trend and EMAs
– Price: $1,955.31
– EMA 20: $2,021.75
– EMA 50: $2,302.43
– EMA 200: $2,934.33
– Regime label: bearish
ETH is trading below all key EMAs, and the short EMA 20 is well under EMA 50, which in turn is far below EMA 200. That is a classic established downtrend, not a fresh pullback. The gap between spot and the EMA 200 shows how much long-term structure has already broken. For now, any push into the $2,020–2,050 band is a rally into resistance, not the start of a confirmed trend reversal.
RSI (momentum)
– RSI 14 (D1): 42.37
Daily RSI is below 50 but nowhere near oversold. Sellers still have the upper hand, but the reading around 42 means we are in a cool-down zone, not panic. Momentum is bearish, yet controlled, which fits a grinding downtrend rather than a capitulation low. There is room for either a short-term bounce or another leg down without hitting extreme levels.
MACD (trend momentum)
– MACD line: -99.64
– Signal line: -134.57
– Histogram: +34.93
The MACD is still negative, so the dominant trend remains down. However, the histogram has turned positive as the MACD line lifts toward the signal line. That is early evidence of downside momentum easing rather than a clean bullish shift. For now, this is a bearish trend with weakening pressure, not a confirmed bullish reversal.
Bollinger Bands (volatility and positioning)
– Middle band (20 SMA proxy): $1,972.74
– Upper band: $2,087.74
– Lower band: $1,857.75
ETH is trading slightly below the mid-band and well above the lower band. That places it in the lower half of the recent range, but not pressed against the lows. Volatility (band width) is moderate. The market is leaning bearish but not stretched. It is a spot where the next move can be asymmetric: a clean break under $1,860 would open a fresh volatility expansion to the downside, while reclaiming and holding above the mid-band would tilt things back toward a mean reversion push into the low $2,000s.
ATR (risk and daily range)
– ATR 14 (D1): $119.66
Daily volatility is elevated but not extreme for ETH. A typical session can swing about $120 from high to low, which is roughly 6% of price. That is enough to punish sloppy positioning and tight stops near obvious levels. Traders should assume that intraday spikes piercing support or resistance by $50–100 are well within normal noise in this environment.
Daily pivot levels
– Pivot point (PP): $1,983.02
– Resistance 1 (R1): $2,013.77
– Support 1 (S1): $1,924.56
Price is currently under the main pivot and hovering closer to S1. That configuration fits a downside-biased but range-bound session. If ETH keeps failing near the pivot–R1 band, the path of least resistance intraday is toward S1 and potentially into the Bollinger lower band region near $1,860.
Hourly chart (H1): short-term pressure, but not a clean trend
Trend and EMAs
– Price: $1,954.98
– EMA 20: $2,001.12
– EMA 50: $1,988.52
– EMA 200: $1,966.13
– Regime label: neutral
On the 1‑hour chart, price is below all three EMAs, but the EMAs themselves are relatively close together. That matches a 1H regime that is leaning bearish in the very short term but lacks the clean structure of a strong intraday trend. For now, this is short-term weakness inside a broader daily downtrend, not a runaway collapse.
RSI (H1)
– RSI 14: 38.2
Hourly RSI is below 40, which confirms downside intraday pressure. However, it is not yet oversold, so there is room for a further push lower before dip-buyers get aggressive. This lines up with the daily picture: sellers are in charge, but the market is not yet in a panic.
MACD (H1)
– MACD line: +1.61
– Signal line: +10.24
– Histogram: -8.63
The MACD is hovering around the zero line, but the histogram is negative as the MACD line sits under the signal line. That is a short-term bearish crossover occurring in a flat environment. It validates the idea of near-term selling pressure, but with no strong acceleration behind it.
Bollinger Bands (H1)
– Middle band: $2,015.73
– Upper band: $2,082.47
– Lower band: $1,948.98
Price is trading right above the lower band. That shows ETH pressing the lower edge of its short-term range, indicating local weakness and a mild oversold condition on the hourly. This often precedes at least a pause or a small bounce, but as long as price hugs that lower band, the market is trying to walk lower along the downside.
ATR (H1)
– ATR 14: $23.51
The average hourly range is around $23, which is consistent with a choppy but not chaotic intraday tape. Moves of $20–30 in a single candle are standard business here, so tight intraday risk limits right at obvious levels, like $1,950 or $2,000, are at risk of getting swept.
Hourly pivot levels
– Pivot point (PP): $1,969.26
– Resistance 1 (R1): $1,986.25
– Support 1 (S1): $1,937.99
ETH is currently trading below the hourly pivot near $1,969, edging toward S1. This layout matches a soft intraday downtrend where sellers lean on intraday bounces toward the pivot and buyers only really show interest around support.
15-minute chart (M15): execution context – short-term exhaustion building
Trend and EMAs
– Price: $1,954.91
– EMA 20: $1,992.64
– EMA 50: $2,004.57
– EMA 200: $1,986.74
– Regime label: neutral
On the 15‑minute chart, price is clearly below all EMAs, with a clean downside alignment (20 < 50 < 200). Structurally, that is a short-term downtrend. Given how far spot has detached from the short EMAs, the market is short-term stretched to the downside on this micro timeframe.
RSI (M15)
– RSI 14: 17.93
This is deeply oversold territory on the 15‑minute chart. In practice, it means the current leg down is overextended intraday. You can still see follow-through when markets are panicky. Even so, more often than not, this type of reading invites at least a technical bounce or sideways pause before the next decisive move.
MACD (M15)
– MACD line: -11.98
– Signal line: -8.59
– Histogram: -3.38
On the very short-term, MACD is negative with the MACD line under the signal. That confirms active downside momentum on the micro timeframe and lines up with the oversold RSI: this is a strong push lower, not a quiet drift.
Bollinger Bands (M15)
– Middle band: $1,994.82
– Upper band: $2,022.91
– Lower band: $1,966.72
Notably, the 15‑minute close at $1,954.91 is below the lower Bollinger Band ($1,966.72). That is a short-term overshoot to the downside. Combined with an RSI under 20, the immediate risk is a snapback toward the $1,975–1,995 zone once selling pressure briefly exhausts. This does not change the bigger trend by itself, but it warns late shorts that their entry timing is poor.
15-minute pivot levels
– Pivot point (PP): $1,956.28
– Resistance 1 (R1): $1,960.28
– Support 1 (S1): $1,950.90
Price is slightly below the local pivot and oscillating near S1. On this micro timeframe, that is the market probing the lower edge of its immediate range. Any firm move back above the pivot would hint at short-term relief after an aggressive sell wave.
How the timeframes fit together
– Daily (D1): Clear bearish regime – price under all main EMAs, RSI sub‑50, MACD still negative. Structure favors the bears.
– Hourly (H1): Tilted bearish but not trending hard. Price is below intraday EMAs and pivot, with momentum pointing down.
– 15m (M15): Strongly oversold and extended on the downside, with price under the lower band and RSI under 20.
Put together, the picture is: macro downtrend, short-term pressure, micro exhaustion. The path of least resistance on the higher timeframe is still lower, but the immediate intraday risk is a counter‑trend bounce rather than an immediate waterfall.
Bullish scenario for Ethereum (counter-trend for now)
A constructive bullish path from here would look like this:
1. Hold above the $1,900–1,920 support zone.
This area aligns with daily S1 ($1,924.56) and sits not far above the Bollinger lower band ($1,857.75). As long as ETH defends this pocket, the market can argue it is building a short-term base rather than breaking down.
2. Short-term relief bounce from oversold intraday conditions.
The 15‑minute oversold cluster (RSI < 20, price outside lower band) sets up the potential for a rebound toward the local value area. First, this would be toward the 15m pivot and EMAs around $1,975–2,000, and then toward the hourly mid-band and pivot region near $2,000–2,020.
3. Daily confirmation above the 20‑day EMA.
The real line in the sand for a tactical bullish bias is the daily EMA 20 at ~$2,022. A daily close above that level, followed by the market using it as support on pullbacks, would signal that sellers are losing control of the short-term trend. That would open a path toward the daily pivot and upper Bollinger band, roughly in the $2,050–2,100 area.
If this bullish scenario plays out, the narrative shifts from trend break lower to mean reversion inside a larger downtrend. The longer-term bear setup would not be fully invalidated, but bulls would regain some initiative.
What invalidates the bullish case?
– A clean break and daily close below $1,860 (near the daily lower Bollinger band) would strongly argue that this is not a base, but a continuation leg down.
– Failure of any bounce to reclaim and hold above the $2,000–2,050 band would keep the move categorized as a weak short-covering rally inside a downtrend.
Bearish scenario for Ethereum (in line with the daily trend)
The bearish path is more aligned with current structure, but it is vulnerable to short-term squeezes:
1. Failing bounces into $1,980–2,020.
With daily and hourly pivots around $1,970–1,983 and the daily mid-band at $1,972.74, any rally that stalls below or around $2,000–2,020 keeps the bears fully in control. Sellers would likely lean into those levels, defending the daily EMA 20 overhead.
2. MACD rolls back down on lower timeframes.
If the short-term relief bounce causes 15m and 1H indicators to reset from oversold back toward neutral, and then MACD on those timeframes turns down again, that would signal a reload of the downtrend rather than a transition to accumulation.
3. Break of the $1,900–1,860 support band.
A decisive move under daily S1 ($1,924.56) and down through the Bollinger lower band (~$1,857.75), especially on rising daily ATR, would mark a fresh leg of the downtrend. In that case, the market would likely start hunting liquidity lower, with the next targets dictated more by prior swing lows and round numbers than by the current indicator set.
If this bearish continuation unfolds, the daily downtrend simply extends, and dips are no longer just tests of support. Instead, they become steps in a staircase lower.
What invalidates the bearish case?
– A sustained daily close above the EMA 20 ($2,022) followed by holding that zone as support would materially weaken the short- and medium‑term bear thesis.
– A shift in daily RSI back above 50 alongside a tightening spread between price and the EMA 50 (~$2,302) would hint that the market is transitioning from trend-down to range or early uptrend.
Positioning, risk, and uncertainty
For traders watching Ethereum crypto oggi, the message from the charts is straightforward but uncomfortable:
– The higher timeframe still belongs to the bears.
– Short-term, the market is oversold enough to punish late sellers.
– Macro sentiment (Extreme Fear, heavy BTC dominance) keeps risk appetite muted for altcoins.
This is an environment where chasing breakdowns after they have already stretched on the 15‑minute chart is dangerous, yet calling a long-term bottom just because of an intraday oversold reading is equally premature.
Pragmatically, professionals tend to let the daily chart define bias, which is currently bearish under the EMA 20 and 50. They then use the hourly to confirm or fade entries, looking for failing bounces or clear reclaim levels, and treat the 15m as execution context, not a thesis driver.
Volatility remains high enough that risk sizing and stop placement matter more than usual. With a typical daily range of around $120, both upside squeezes and downside flushes can happen faster than many traders expect. The technicals do not rule out a sharp short-covering rally, but until ETH can reclaim and hold above roughly $2,020–2,050, any strength should still be viewed as rallies inside a broader downtrend, not the birth of a sustained bull leg.