

Despite the calm appearance on the chart, Dogecoin crypto is currently trading in a tight range below key trend levels, inside a clearly bearish broader structure.
Summary
Market Thesis: Dead Calm Inside a Bearish Structure
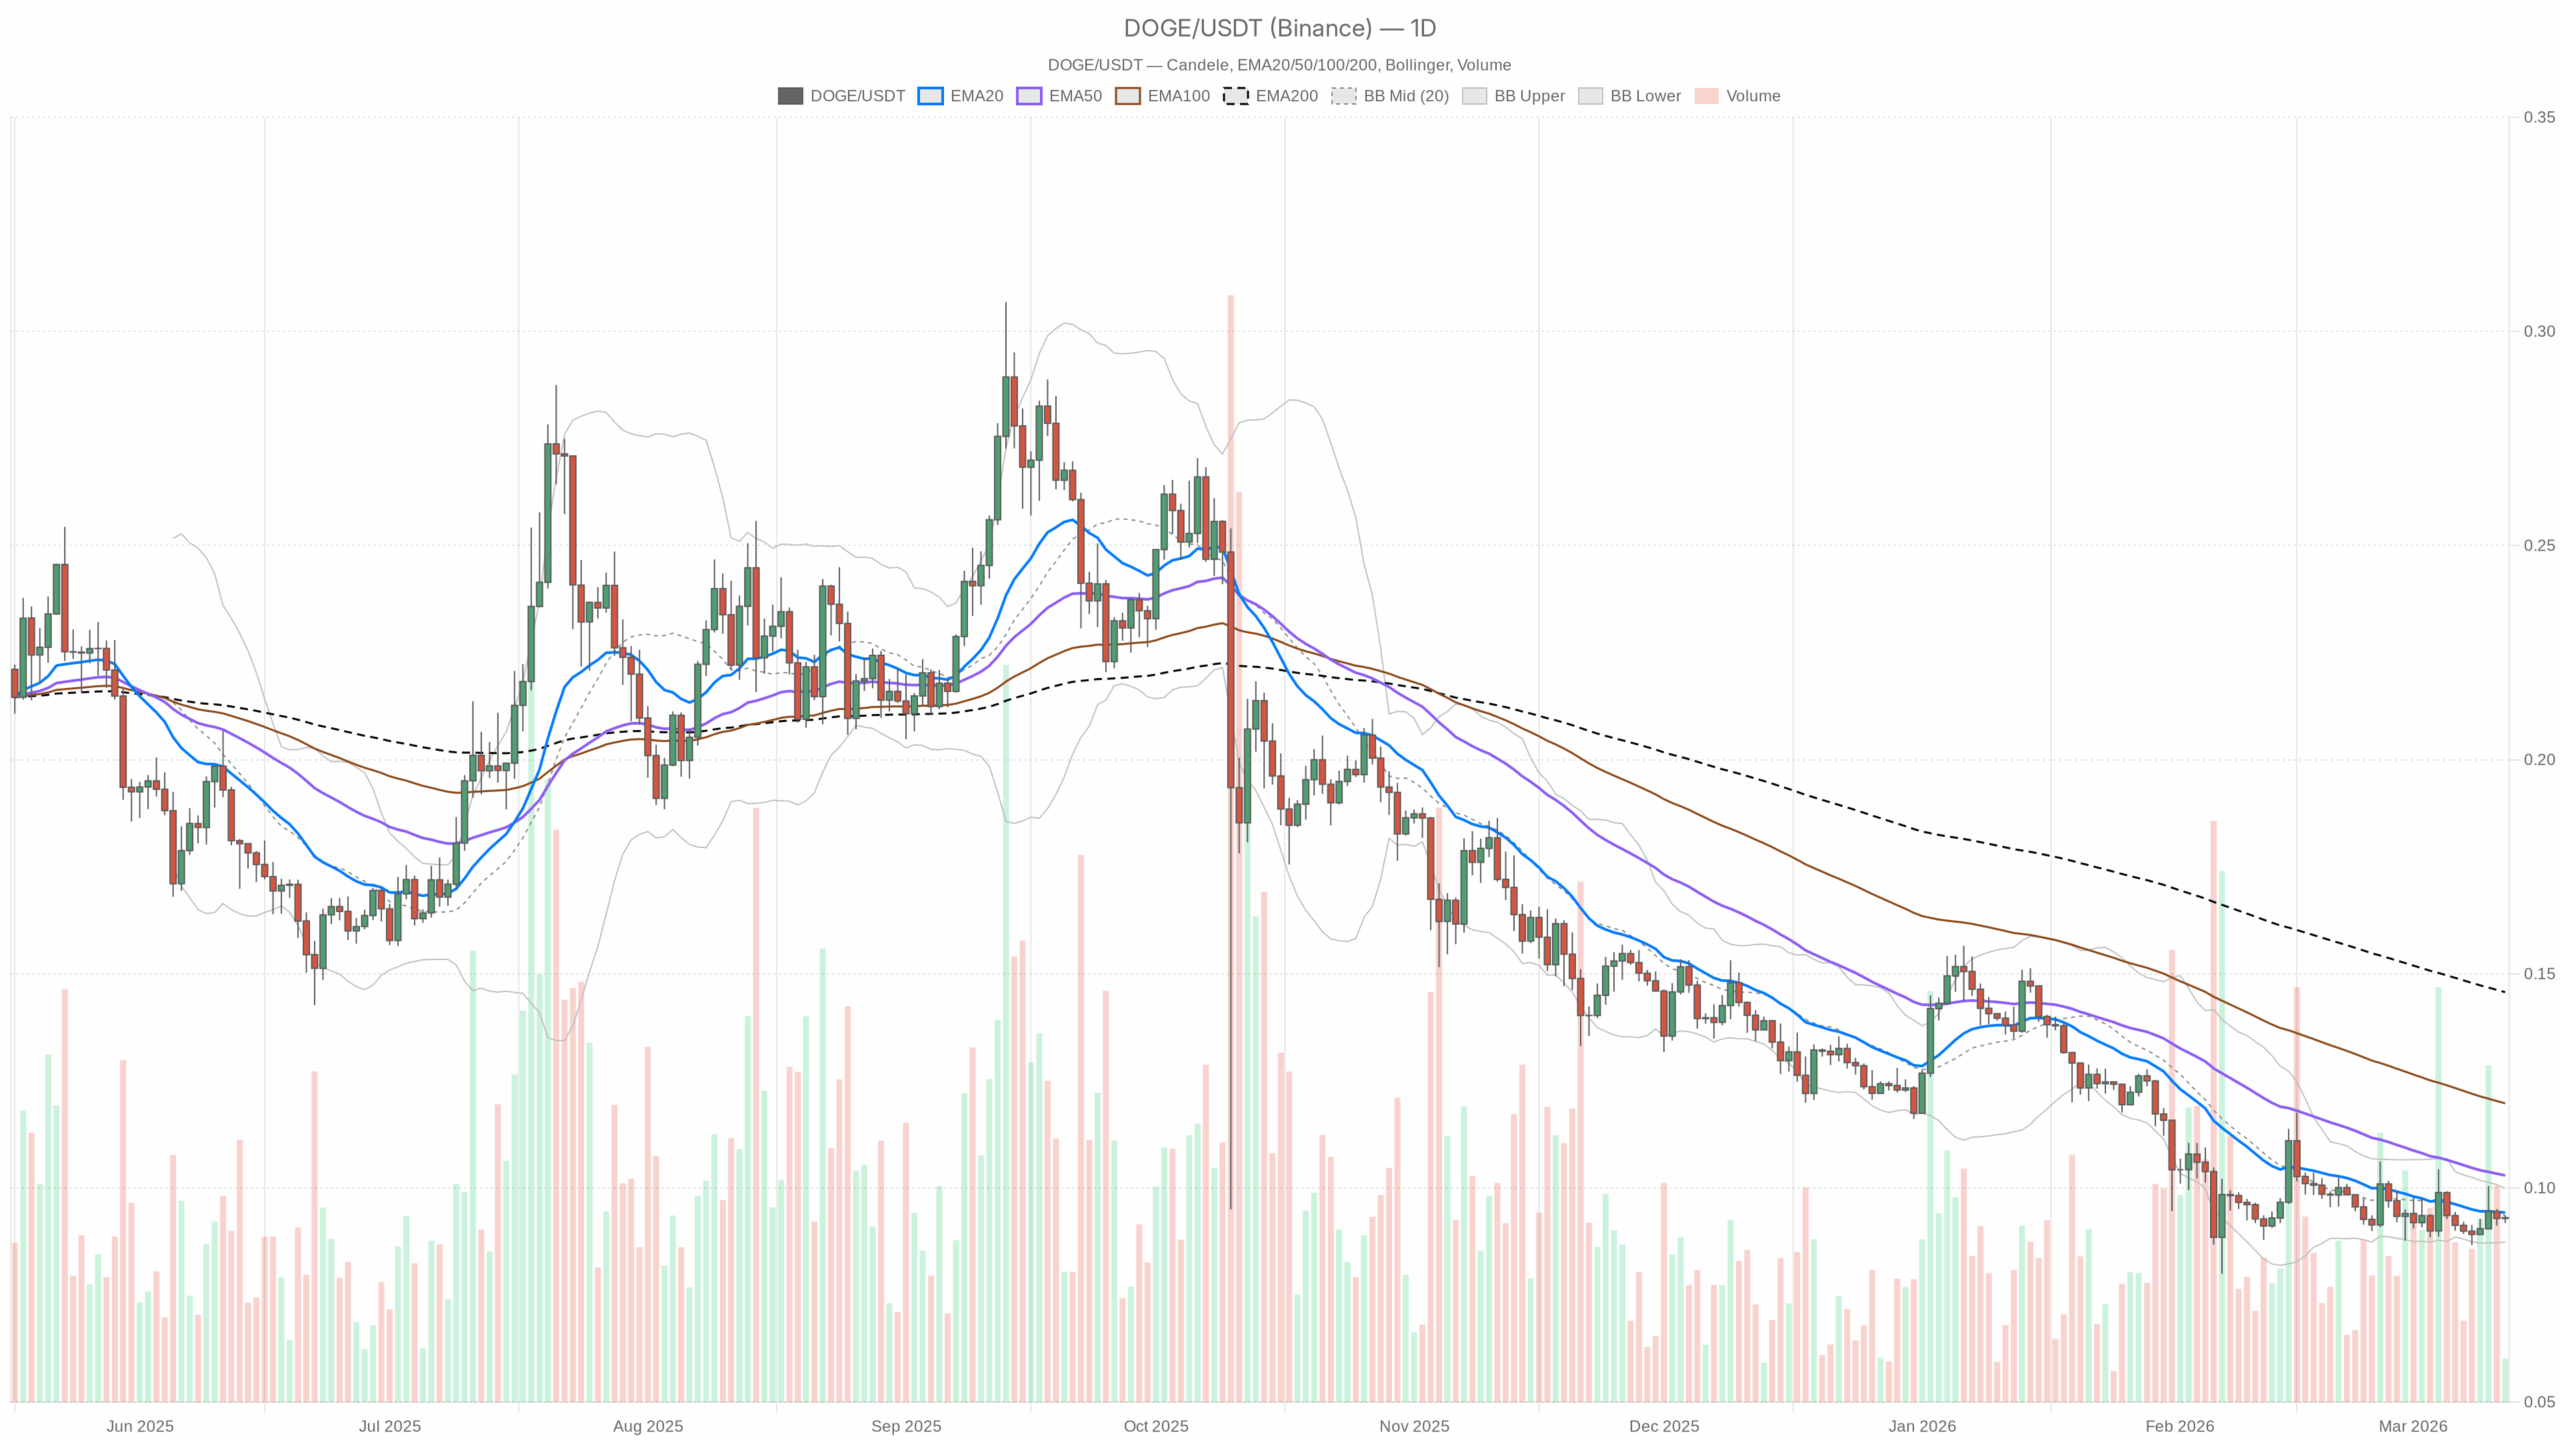
Dogecoin against USDT is sitting around $0.09, and the bigger picture is still structurally bearish. Price is trading well below the 200-day EMA, and the daily regime is flagged as bearish, which tells you the prevailing trend is still down, even if the last few sessions look flat. This matters because when you see tight ranges and low volatility under a falling long-term average, you are usually looking at a market that is coiling for the next leg, not one that has already reversed.
The dominant force right now is compression: volatility is low, intraday timeframes are neutral, and liquidity is picking its spots. Moreover, a crypto-wide backdrop of Extreme Fear (fear & greed index at 18) and elevated Bitcoin dominance (~57%) creates an environment where speculative names like Dogecoin tend to be treated as optional, not essential. Mean reversion bounces can happen, but the burden of proof is on the bulls to change the daily structure.
Multi-Timeframe Bias
Daily (D1): Bearish Main Scenario
On the higher timeframe, Dogecoin is in a bearish regime. Price is at roughly $0.09, sitting under the 50-day and well beneath the 200-day EMA (~$0.15). That positioning keeps the primary trend down, even if price is hugging the 20-day EMA. Until DOGE starts reclaiming those higher EMAs, rallies are, by definition, countertrend.
1-Hour (H1): Neutral, Micro-Stabilization
On H1, price is clustered around $0.09 with the 20, 50 and 200 EMAs essentially on top of each other and the regime marked as neutral. The market has lost directional conviction intraday; this is classic equilibrium after a move. It does not contradict the daily downtrend; it just means the market is catching its breath.
15-Minute (M15): Neutral, Execution Only
The 15-minute chart mirrors the hour: neutral regime, price glued to its short EMAs. This is useful only for execution timing, as it tells you there is no immediate momentum push in either direction. Any breakout from here, up or down, will stand out clearly against this low-volatility backdrop.
Daily Technicals: Evidence for the Bias
Exponential Moving Averages (EMA)
- EMA 20 (D1): ~$0.09, roughly at the current close.
- EMA 50 (D1): ~$0.10, above current price.
- EMA 200 (D1): ~$0.15, well above current price.
The short EMA (20) acting as a magnet around price says the market is in equilibrium after a prior move, but the 50 and 200 EMAs overhead define a clear downward hierarchy. In simple terms, Dogecoin is trying to stabilize, but it is stabilizing below its medium- and long-term trend lines. That is classic bear-market behavior unless and until those EMAs are reclaimed.
RSI (Relative Strength Index)
- RSI 14 (D1): ~46
Daily RSI hovering below 50 shows slight bearish pressure but not capitulation. We are not in oversold territory, so there is no forced mean-reversion signal here, but buyers are not in control either. This level fits a market that is drifting sideways-lower, waiting for a catalyst.
MACD
- MACD line: ~0
- Signal line: ~0
- Histogram: ~0
MACD being effectively flat tells you momentum has reset. The prior trend has run its course for now, and neither side has a clear momentum edge in the very short term. Inside a bearish larger structure, a flat MACD is often the pause before the next impulse, not necessarily a trend reversal.
Bollinger Bands (D1)
- Middle band: ~$0.09
- Upper band: ~$0.10
- Lower band: ~$0.09
The bands are extremely tight, with price pinned near the middle. This is a textbook volatility squeeze. When you see bands compress this much under a declining 200-day EMA, it usually means a bigger move is being loaded, but the direction is still open. In other words, expect an eventual expansion in volatility; do not expect this sleepy range to last.
ATR (Average True Range, D1)
- ATR 14: ~$0.01
An ATR around one cent at a $0.09 price level signals muted realized volatility. Daily swings are small in percentage terms for a meme coin, which again confirms the current calm. This low ATR, combined with tight Bollinger Bands, reinforces the idea that risk will likely increase when the next directional move kicks in.
Pivot Levels (D1)
- Pivot point (PP): ~$0.09
- R1: ~$0.09
- S1: ~$0.09
Pivot levels collapsing onto the current price level tell you the recent trading range has been exceptionally narrow. The market does not yet have a clear reference high or low to lean on for the next move; traders will likely anchor to round numbers, for example $0.085–0.095, until a real breakout sets fresh levels.
Market Context: Risk Appetite and Macro Backdrop
The broader crypto market cap is around $2.47T and up modestly in the last 24 hours, but volume has slipped. Bitcoin dominance at roughly 57% and an Extreme Fear sentiment reading is a classic risk-off cocktail for altcoins. Capital prefers perceived safety, such as BTC, large caps, and stables, over speculative memes like Dogecoin.
For Dogecoin specifically, this means any upside will likely need either a broad risk-on turn in the market or a coin-specific catalyst. In the absence of that, the path of least resistance often ends up aligned with the higher timeframe trend, which right now is down.
Scenarios for Dogecoin Crypto (DOGEUSDT)
Primary Bias: Bearish, with Volatility Risk Building
The daily downtrend, price below the 50/200 EMAs, and sub-50 RSI combine into a bearish primary scenario. The neutral lower timeframes and flat MACD do not negate this; they simply say the market is in a holding pattern before the next significant swing. Within this context, Dogecoin crypto trades like a compressed spring, where positioning and risk management matter more than prediction.
Bullish Scenario
For a credible bullish case, DOGE needs to:
- Hold and build a base around $0.09, avoiding sustained closes below that level.
- Break above the short-term ceiling near $0.10 and the daily EMA 50, with RSI pushing decisively above 50.
- Show a positive expansion in MACD, with the line crossing above signal and a rising histogram, alongside widening Bollinger Bands to the upside.
If that happens, the market shifts from a bearish trend with a pause to a potential trend transition. The next logical magnets would be the $0.12–0.13 zone, and then the long-term EMA 200 near $0.15. That latter region would be a key battleground, as reclaiming and holding above it would represent a major structural change.
What invalidates the bullish setup?
A clean breakdown below the recent base at $0.09 on rising volume, with RSI rolling back toward 40 or lower and MACD turning negative as volatility expands downward. That would signal that the attempted base failed and that the downtrend is reasserting itself.
Bearish Scenario
The bearish path leans on the existing structure:
- DOGE fails to reclaim and hold above $0.10, with intraday rallies fading quickly around the 50-day EMA.
- Volatility expands from the current squeeze with price breaking below the $0.09 consolidation floor.
- RSI slips decisively below 45 and trends toward the low 40s or 30s, while MACD turns negative from its current flatline.
Under that setup, the market would likely probe lower supports, for example prior swing lows around the mid-to-high $0.07–0.08 area, depending on your chart history. In a backdrop of extreme fear and high BTC dominance, that kind of continuation move is entirely feasible if broader risk appetite deteriorates again.
What invalidates the bearish case?
A sustained break and hold above the $0.10 region and then a firm close above the 50-day EMA, ideally backed by higher volume and a shift in RSI above 55–60. That would say selling pressure has been absorbed and short-covering plus fresh demand are starting to dominate.
Positioning, Risk, and Uncertainty
Dogecoin is currently in a compressed, low-volatility pocket inside a broader bearish structure. That combination can be deceiving: it feels safe while nothing moves, but the next expansion in volatility is where most of the real P&L will be made or lost.
From a trading perspective, this is a market where:
- The daily trend still argues for caution with directional long exposure.
- The neutral intraday charts say there is no urgency to chase either direction until price breaks away from the $0.09 gravity zone.
- Volatility risk is asymmetrically high: a squeeze this tight rarely resolves into another week of sideways chop.
Regardless of bias, the key is to respect the levels and the regime: $0.09 as the current balance point, $0.10 and the 50-day EMA as the first meaningful resistance band, and the broader context of extreme fear in the market. Until Dogecoin proves otherwise on the chart, the trend remains down, and any bullish narrative needs to be backed by price, not hope.
In summary, the market is quiet but not resolved. The structure, volatility profile, and macro context all argue that the next decisive move is still ahead, not behind.