


Yesterday, Bitcoin recovered the key level of 70,000 USD with a daily candle of +3.97%, following Sunday’s pump which saw another +5% printed: let’s see how the price analysis has now changed.
Now is the moment of truth: this latest movement opens the doors to a restart of the crypto asset towards new all-time highs or will there be a rejection before $74,000?
In this article we will see an analysis of prices and an in-depth look at ETF data and derivative market metrics.
All the details below.
Summary
Bitcoin price analysis: the crypto recovers 70,000 USD
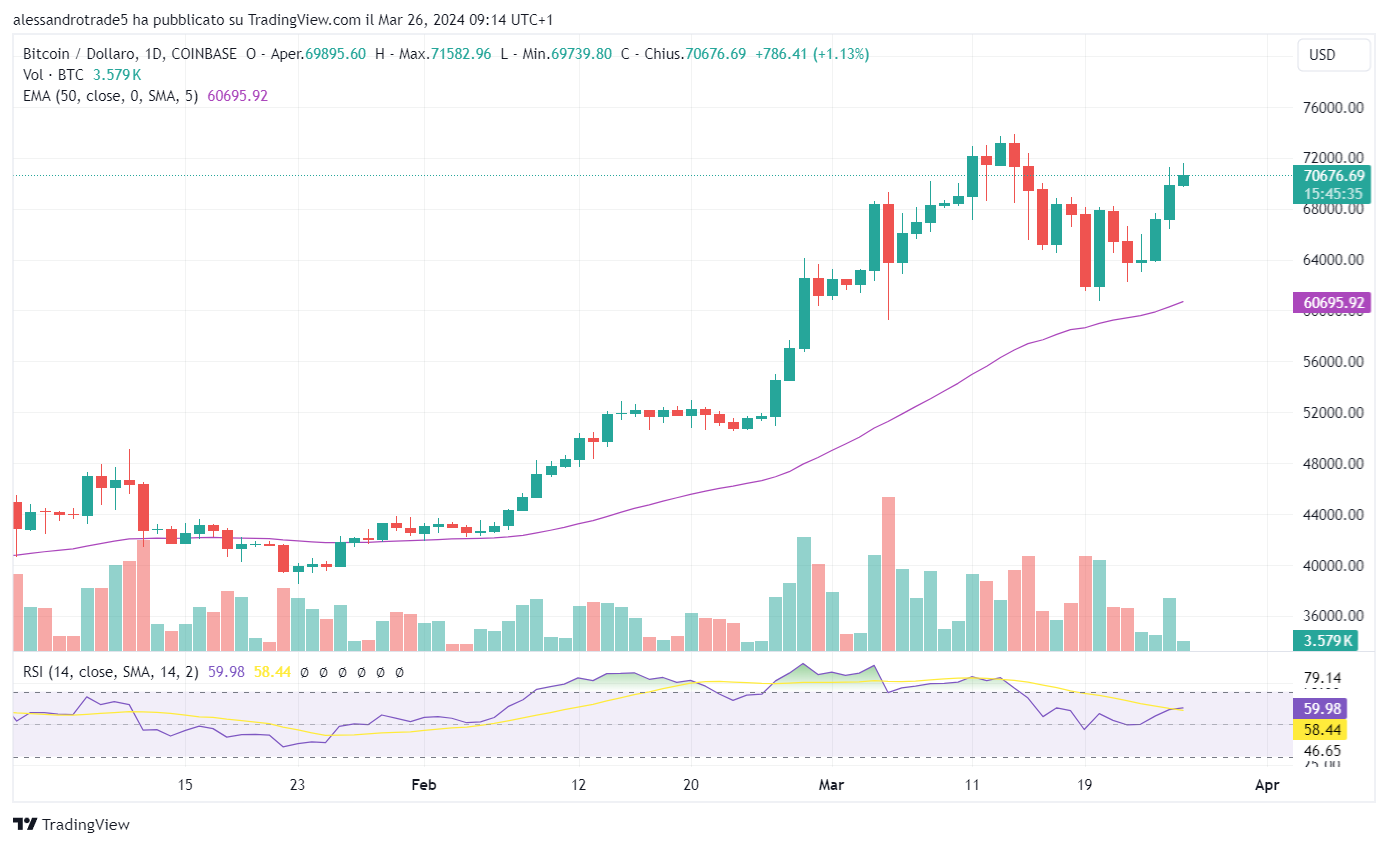
After 10 days of suffering, Bitcoin returns to push on the charts going to recover the price level of 70,000 USD; so important for the price action of the currency, which could now aim for new highs.
Technical analysis signals the possibility of an imminent attack in the $74,000 zone, but bulls must be careful of possible fake movements or bear absorptions.
The game is played here, in the macro price range between 74,000 and 60,000 USD: until Bitcoin breaks in one direction or the other, we will not have confirmation of what is happening.
In the case of a bullish breakout, we could expect a follow-up in demand of about 5% in the following hours, with an estimated value of the crypto equal to 77,700 USD.
On the other hand, in case of a bearish breakdown from current prices, if the EMA 50 were not to hold, we could hypothesize a first response signal around 59,000 USD, with the second at 55,000 USD and the third at 52,000 USD.
Obviously the main trend is strongly bullish, but it comes after an extended phase in which the crypto has performed at its best in the last 2 months, growing by 65%.
The market volumes in the last candles are not particularly encouraging, especially that of Sunday, March 24th (arrived with American markets closed) where on Coinbase only 6,500 BTC were exchanged.
Even the RSI doesn’t look very promising, with the indicator signaling the presence of a tired chart trying to recover after a sharp slowdown.
In the medium term, the prospects are more positive and less controversial, with the majority of experts in the sector agreeing on an optimistic price analysis, which will likely see the breaking of $100,000 USD within the next two years and the celebration of a historic bull run.
It will be very interesting to monitor the situation of the yellow coin in the next two months, waiting for the London Stock Exchange to inaugurate the so-called crypto exchange-traded notes (ETN) on May 28th.
From here on, other regulated markets from around the world could open up to speculation in Bitcoin, Ethereum and other cryptocurrencies, offering new tools that by investing directly in the underlying of these resources created scarcity on the supply side.
All of this, combined with the narrative of the halving, which will reduce the emissions of new BTC by 50%, will be crucial in pushing its price towards new, still unexplored horizons.
The overall outlook appears to be largely bullish, especially considering the latest words of Powell in last week’s FOMC meeting where supportive words were adopted for the more speculative American markets.
Analysis of ETF data and derivative markets
To offer a complete reflection after analyzing prices, let’s take a look at the data related to the money flows of the last few days for Wall Street spot ETFs and see what the data from the derivative markets suggest.
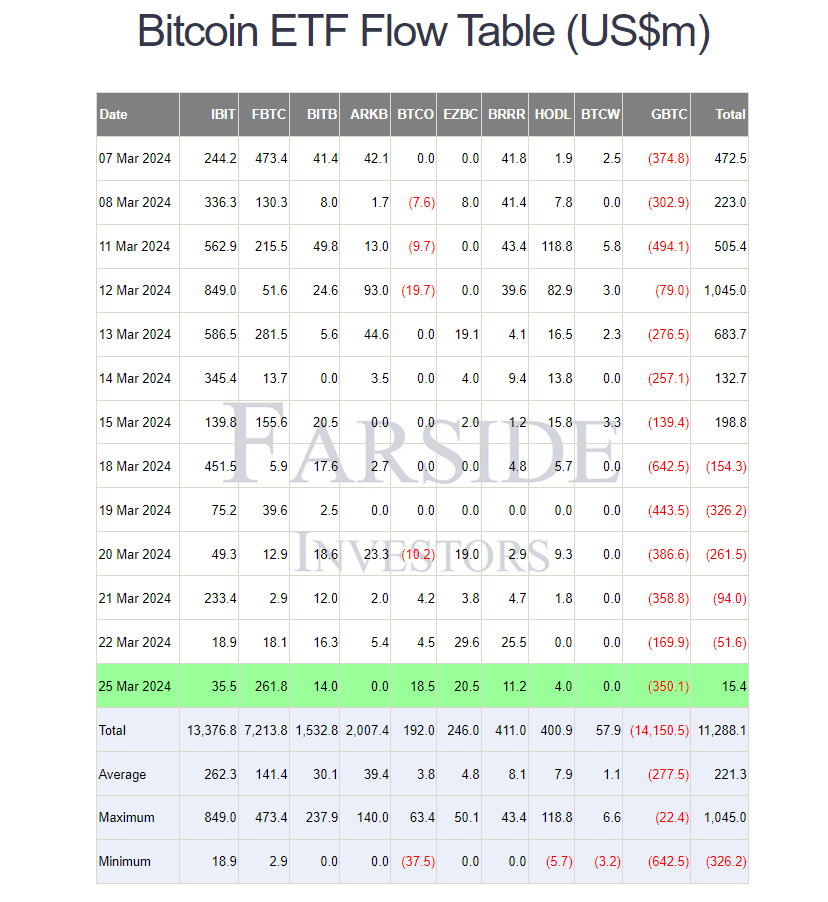
On the ETF front, we can see how, according to what was reported by “Farside”, yesterday was overall positive for Fund Manager investments, with positive flows of just $15.4 million.
Among buyers, Fidelity was the best yesterday with $261.8 million followed by BlackRock with $35.5 million
The data, although representative of a solution still in balance, makes us smile because it comes after a long week of heavy outflows, with GBTC alone unloading almost 2 billion dollars.
The results of the next few days regarding capital flows from ETFs will be crucial to give us an idea of what to expect on crypto asset prices.
Indicatively, with each positive netflow, Bitcoin records significant increases, while with each negative netflow, it is negatively affected graphically.
Overall, we can say that so far the introduction of these investment tools has benefited the price action of the currency, which has seen net inflows of capital into the markets for 11.2 billion dollars from January to date.
In the future, this trend could take on increasingly bullish connotations, seen and considering the opinion of experts like the investment bank Standard Chartered, which predicts an inflow of $100 billion into the Bitcoin ETF market by the end of the year.
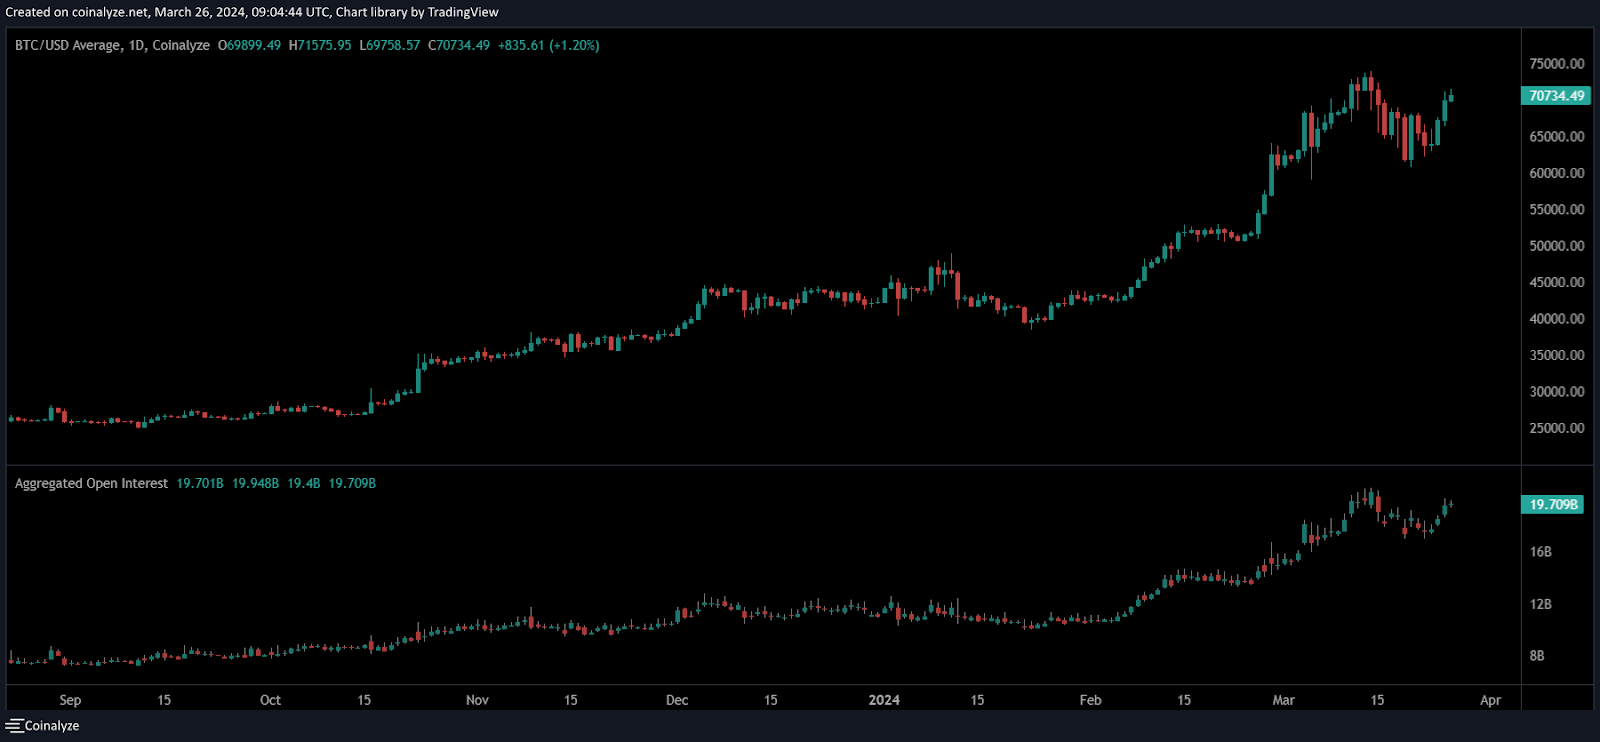
Now moving on to the analysis of data on derivative markets, we can highlight the presence of a “open interest” still significantly high, amounting to 19.7 billion dollars at the time of writing the article, with speculators’ interest increasing more and more as the crypto approaches its historical highs.
We remember that just 2 months ago this indicator represented half of the current value: there are therefore almost 10 billion dollars entered the market in the last 60 days that have started betting on BTC prices higher than 42,000 USD.
If the open interest were to experience a sharp drop, Bitcoin would certainly be negatively affected as well. As long as the metric remains at these levels, the situation is under control.
The funding rate on all cryptocurrencies present in the futures markets is positive, with funding rate values ranging from 0.027% for Bitcoin to 0.08% for Pepe.
It is worth noting how after yesterday’s last bullish movement, the funding rate has remained mostly unchanged, meaning that traders have not exposed themselves in one of the two directions more than they were the day before.
The market bias remains, as stated several times, openly bullish; the chances of a continued bullish trend far outweigh those of a hypothetical reversal.
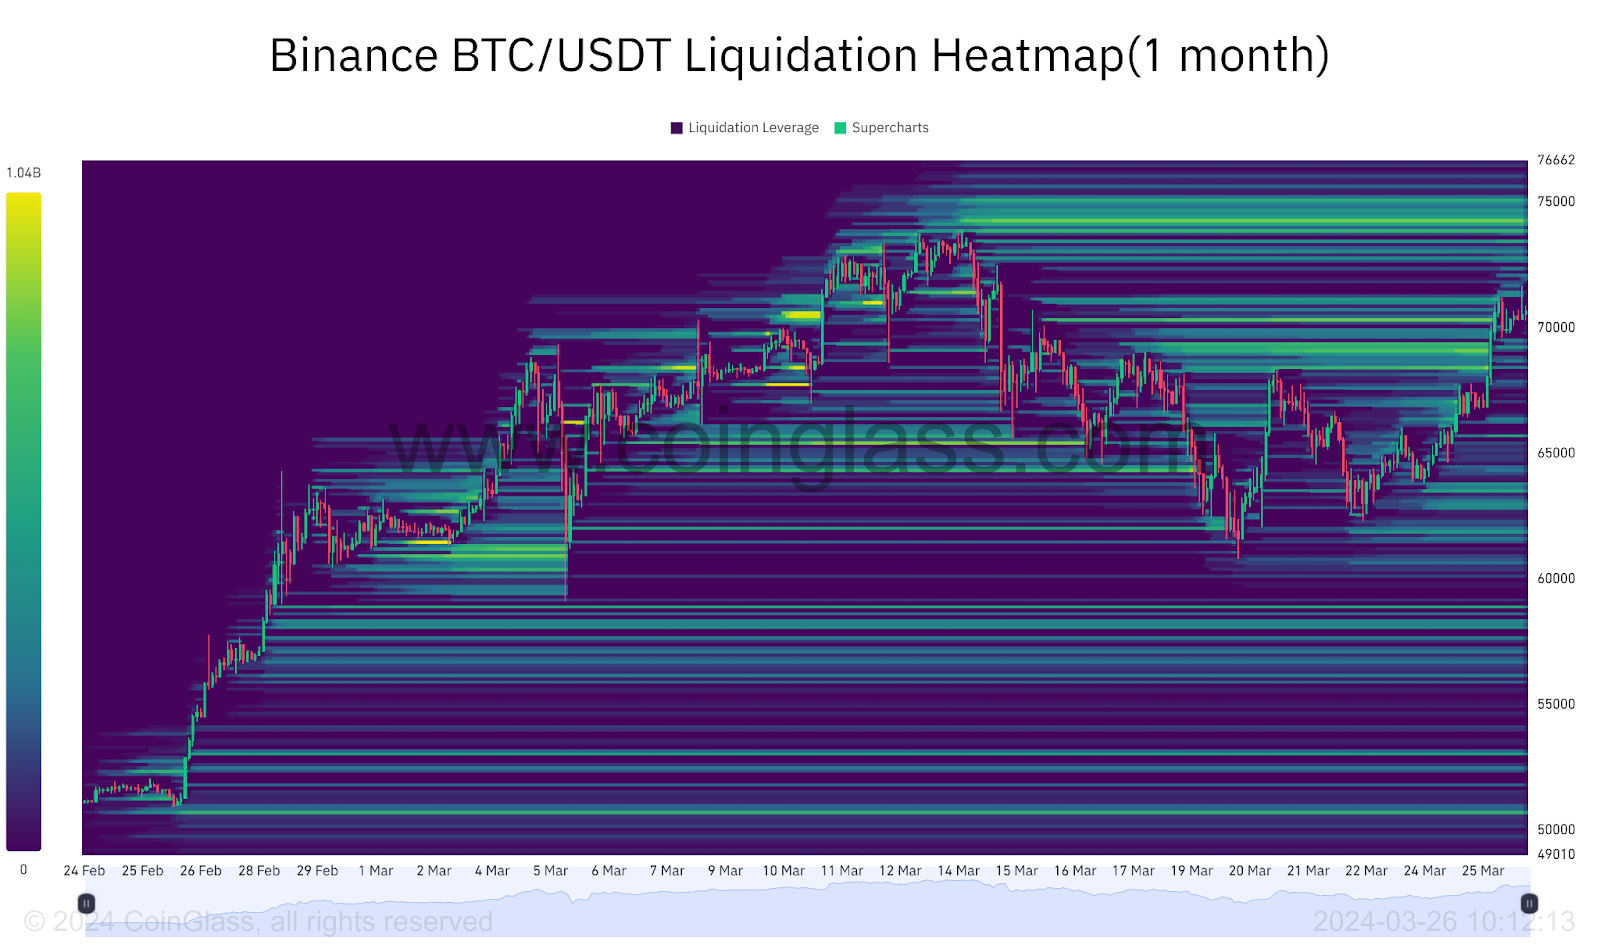
There are no significant liquidations to report in the last few hours, where few financial operators have lost money due to market volatility.
At most, we point out the presence of a very important liquidation level at the Bitcoin highs threshold of 74,000-75,000 USD, where a break could lead to the evaporation of over 2 billion dollars in short positions.

