

Candlestick analysis is definitely one of the first technical concepts to learn before engaging in crypto trading. It is part of the basic rules of trading and allows learning to read the hidden meaning of charts.
Summary
Candlestick analysis
Candlestick analysis was born in Japan in the 18th century and is one of the oldest methods of financial market analysis.

Taking the graph above as a reference, you can immediately notice an alternation of vertical rectangles of different colours as well as less visible lines emerging from them. These rectangles are called candles.
This representation provides immediate benefits even for novice traders as it displays the imbalance of power between buyers and sellers in each individual trading session.
The session represents the period of time on the chart that is chosen to display for the candles and can be more or less extensive depending on the need. Usually, it can go from a single minute, day, month, to a full year and so on.
If for example a 15-minute candlestick is chosen as in the image above, each candle shown will represent a trading session of 15 minutes.’
The chart is built on the basis of 4 simple price parameters:
- opening;
- maximum;
- minimum;
- closing.
What do the candles consist of?
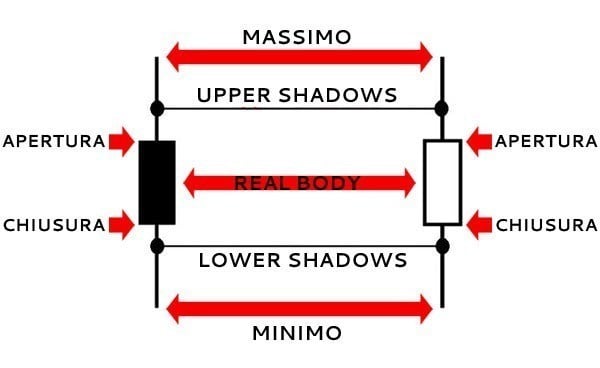
- Real body: represents the body of the candle that is obtained starting from the opening price of the market and ending on the closing price;
- Shadows: the thin vertical lines that start from the body and reach the maximum and minimum price.
Normally the candles become green (or white) if the closing of the market is positive compared to the opening and red (or black) in the opposite case.
In the most popular trading software, it is common practice to fill the body of the bearish candle and leave empty (only colouring the outlines) that of the bullish candle.
9 different types of candles
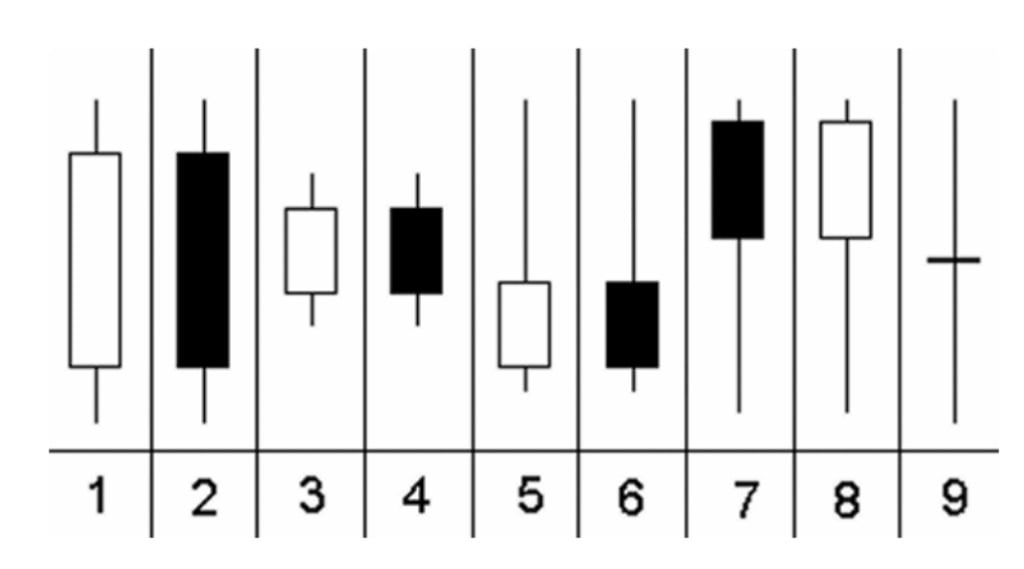
Each possible type of candle will be important when trying to understand the market trend and avoid confusion during trading.
- Long white body: a sign of a strong bullish push and of a market that is pushing in a single direction, that is, upwards. The presence of this type of candle suggests the same bullish scenario also for the following session;
- Long black body: a sign of strong bearish push and consequent “price collapse”. As for the previous one, there is a high probability of a further decline in the next session;
- Small body/spinning top: candles that have a small body and represent a substantial balance between buyers and sellers, therefore a stable market situation regardless of the colour of the candle. They point to future market instability, which could be both upward and downward;
- Upper shadow lines: the strongly pronounced upper vertical lines indicate that attempts by buyers to raise prices further did not prevail over the return of sellers. The implications are bearish also for the next session.
- Lower shadow lines: this candlestick pattern is mirrored to the previous one and often occurs after a rather marked downtrend. In this case, the further bearish lengthening by the sellers collides with a mass return of the buyers who raise the price. A bullish impulse is expected for the next candle;
- Doji: We are in the absence of the body of the candle in which there is an absolutely balanced situation and the opening price is identical to the closing price. Represents maximum uncertainty in the market. In the Japanese tradition, it means that the market is at a crossroads.