

Like the stochastic oscillator, moving averages and the ADX indicator, Pivot Point and Parabolic SAR also fall within the circle of the most widely used technical indicators in the trading world.
Summary
Pivot Point
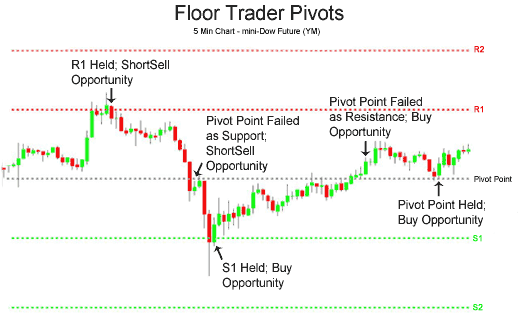
One of the operational techniques used by traders to identify support and resistance is to calculate pivot points.
Pivot points are defined as graphical signals that allow understanding what are the movements that could affect the markets. In fact, they are levels of support and resistance, valid for the next session, calculated using mathematical formulas. They were introduced by a floor trader from Chicago, Neil Weintraub, and later by Charles Le Beau and David W. Lucas.
They determine the entry or break-out points.
To calculate them, the following data is required:
- Maximum price (H);
- Minimum Price (L);
- Closing value (C);
- The average price (AP) is calculated using this formula: AP = (H + L + C) / 3.
Pivot Point calculation:
1st Pivot Support: S1 = (2 * AP) – H
1st Pivot of Resistance: R1 = (2 * AP) – L
2nd Pivot Support: S2 = AP – (R1 – S1)
2nd Pivot of Resistance: R2 = (AP – S1) + R1
3rd Pivot Support: S3 = S2 – (Maximum – Minimum)
3rd Pivot of Resistance: R3 = R2 + (Maximum – Minimum)
S1, S2, S3 are the three expected supports while R1, R2, R3, the three possible resistances. When prices reach one of the levels it will be considered as real support (or resistance). They are a tool that every trader should know how to use because they allow to quickly calculate the levels on which statistically the greatest reactions of the market are recorded.
Parabolic SAR
The Parabolic Stop and Reversal (SAR) is an indicator that signals very clearly what is the behaviour of a market trend. It is mainly used by traders who want to limit their losses. Graphically, it looks like a dotted line that follows the asset above (or below) the prices.
If the line is above the prices, then there is a downward trend. On the contrary, if the line is below the prices then the trend is bullish or the prices are rising.
 The objective of this oscillator is to identify the point of a possible reversal of the current trend. This point is called SAR, or – Stop and Reverse Point – and is calculated with the following formula: SAR (tomorrow) = SAR (P) + FA * (P – SAR(P)):
- SAR(P) = SAR of the previous day;
- AF = Acceleration factor;
- P = Price deemed significant.
Unlike moving averages, it is not the price that moves above or below the average, but the oscillator itself that, if certain conditions occur, moves below and above the price, thus providing signals for trading.
If at some point prices reach a new low and then rise again, the position to be taken in the market is bullish. This starting point is called SAR Initial Point – (SIP). The latter will be the lowest price recorded during a downward trend and the highest price in the opposite case.
Perhaps the most important variable is the acceleration factor of the parabola, consisting of a progression of numbers from 0.02 to 0.2 and then remains constant. The increase is made each time the trend indicates a new high or new low.
When a position is taken, the acceleration factor is worth 0.02, it increases by 0.02 when a new maximum is reached (if in a higher position) or a new minimum is reached (if in a lower position). If no new maximum or minimum levels are reached, the last acceleration factor is used.
The validity of the signals of the parabolic system depends substantially on the type of market in which the trader operates. In the presence of clearly oriented trends, the effectiveness of this tool increases considerably, as the price movements are prolonged over time and extensive. During the distribution or accumulation phases, on the other hand, the probability of false signals is relatively high.