

Bitcoin closed the weekly candle +15.66% and saw immediate buying pressure on the new day and week pushing the price back above $57,000, which started to let people ask about the price prediction for the short term.
Bitcoin price spent the bulk of Sunday in red figures and closed out the daily candle -2.12% [$56,577.93].
The world’s preeminent money and number one crypto asset by market capitalization has spent the last few days range bound in between where it peaked last month [$64,804.72] on Apr 14, 2021 (19 days ago] and where it bounced [$47,409.83] on April 25th.
Down -11.6% from its ATH, where is Bitcoin going next?
Summary
Are Bitcoin’s Bearish Obstacles in the Rear View?
At the time of writing Bitcoin [$57,548.44] is up over $800 on the new day and pushing higher above all of the bearish barriers and moving averages.
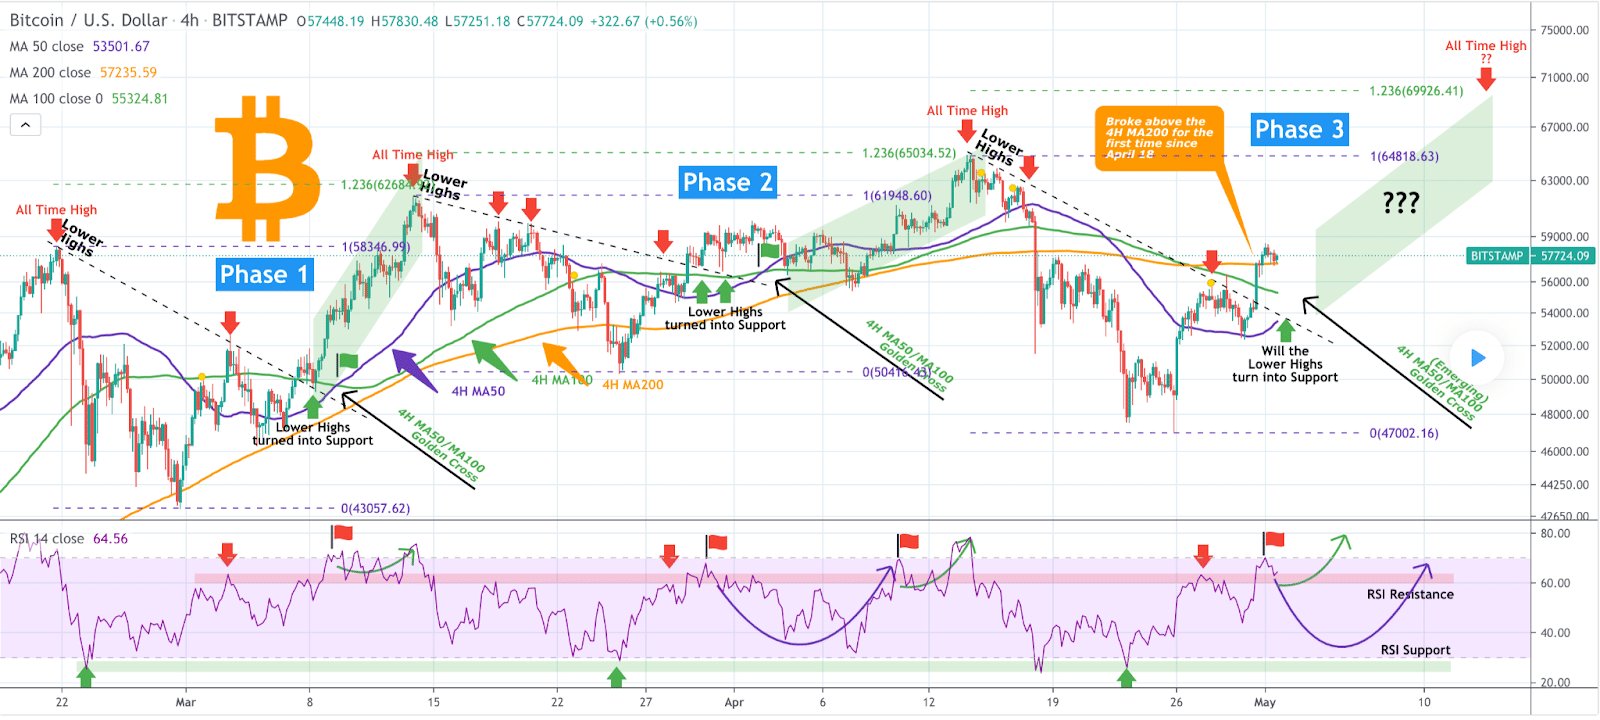
As illustrated below by TradingShot a user on TradingView, BTC is setting up for much higher prices if it can push off of the moving averages on the 4HR chart.
This user has charted BTC to push above $70,000 if it hits the measured move upward and continues its bull cycle before any further selling pressure from bears ensue.
Bitcoin Price Prediction
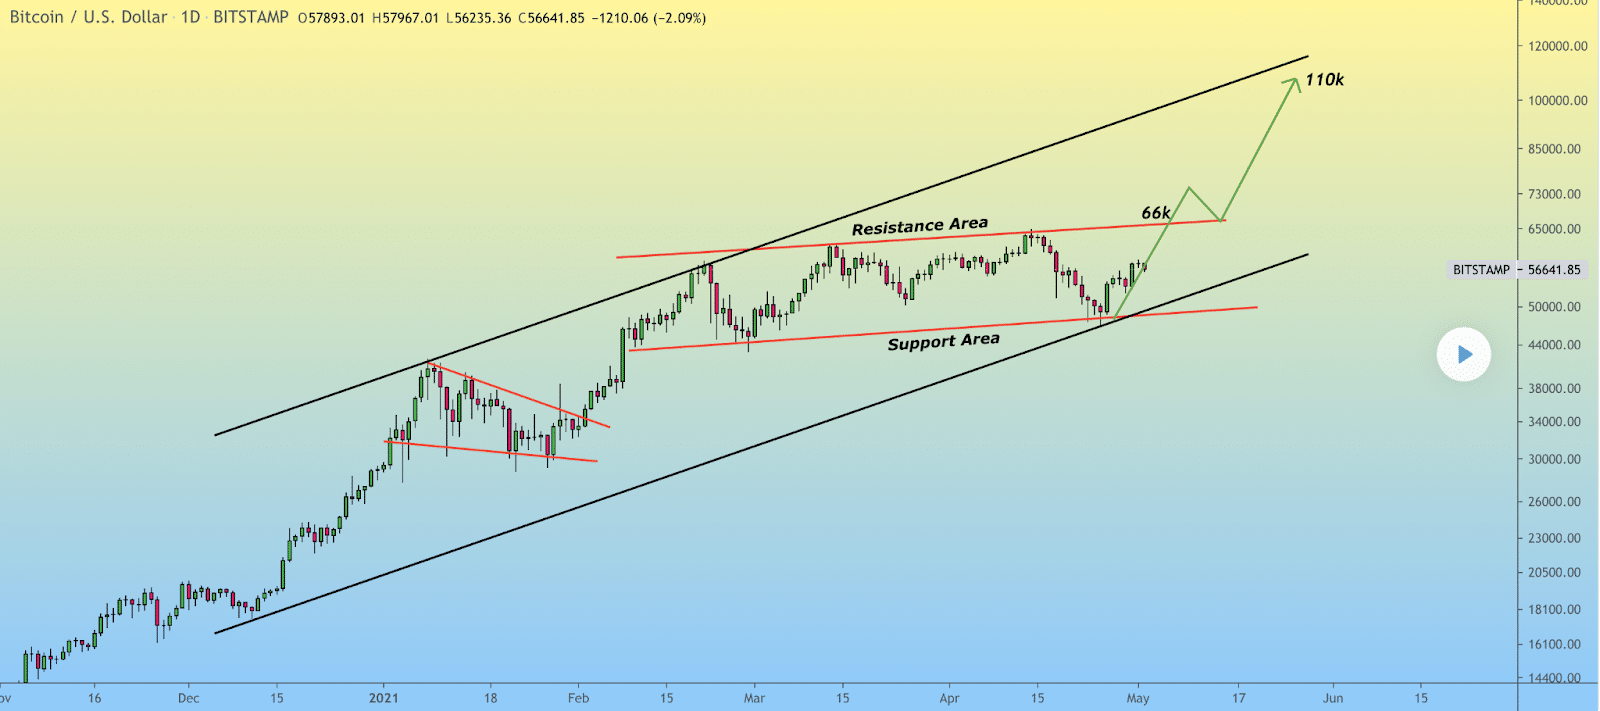
$70,000+ may only be the beginning of the next wave up however. Faibik, another TradingView analyst points out that Bitcoin has been trading within the same ascending channel now for the last 5 months. This is a super bullish channel that has seen numerous BTC ATHs made over this time frame.
This ascending channel could lead to a test sooner than many might expect towards a six-figure and $100,000+ BTC price for the first time in the asset’s history.
A Contrary Bearish Outlook for Equal Measure
It would be a misstep to fail to address the possibility that BTC breaks down from here because anything can happen in markets. If BTC would break down here the first support and an important region to regard as critical is the 100 Day Moving Average [$55,324.81]. Anything below that level would encourage bulls to hope for a bounce at the 50 DAY MA at [$53,501.67].
If those levels are in fact breached it would be time for new analysis and a bit of concern but for now the price action suggests upward moves are forthcoming. A push above $60,000 is looking imminent and any sort of substantial amount of time above that region would suggest a test of the ATH is not far off.
Traders will be looking for significant candle closes such as the 4HR when $60,000 is again overtaken. This would be a good indicator that BTC will again test its ATH in pursuit of new milestones.