The past week has started to add some wind to the sails of bitcoin, Ethereum and the overall macro crypto market. The aggregate crypto market capitalization is back over $1.5 trillion and better times for all appear to be just over the $41k bitcoin rubicon.
Bitcoin
Bitcoin looked at times during last week like it was going to test the bottom of its range or at least $30k again but bears failed to push the price beneath $33k.
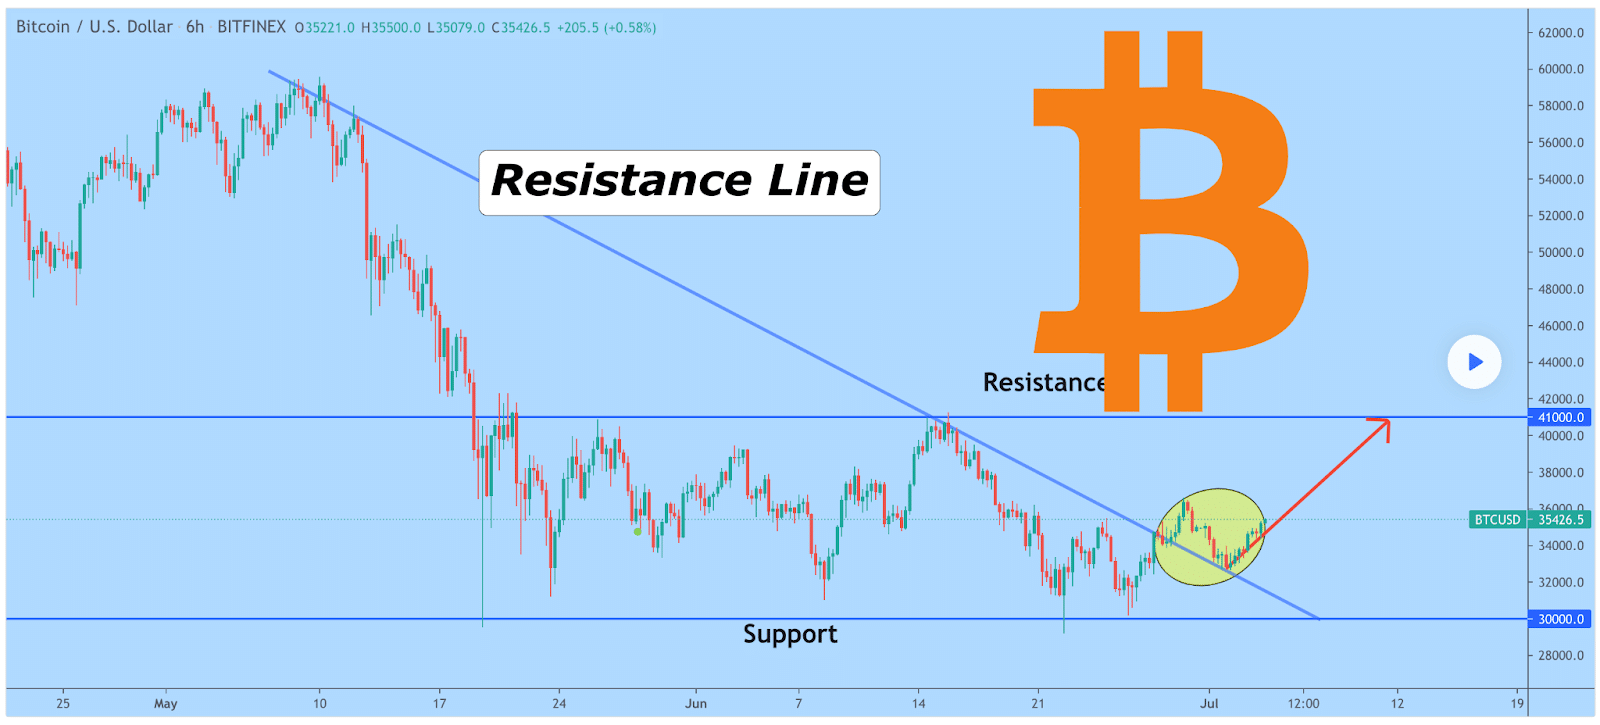
The below 6hr chart from AtlasTrades shows the bounce off of a long term trend line which the author believes could lead to a test of $41k. That price may arguably be the most pivotal price point to get the bull market back on track and may actually determine the next 6 months for bitcoin and much of the alt coin market.

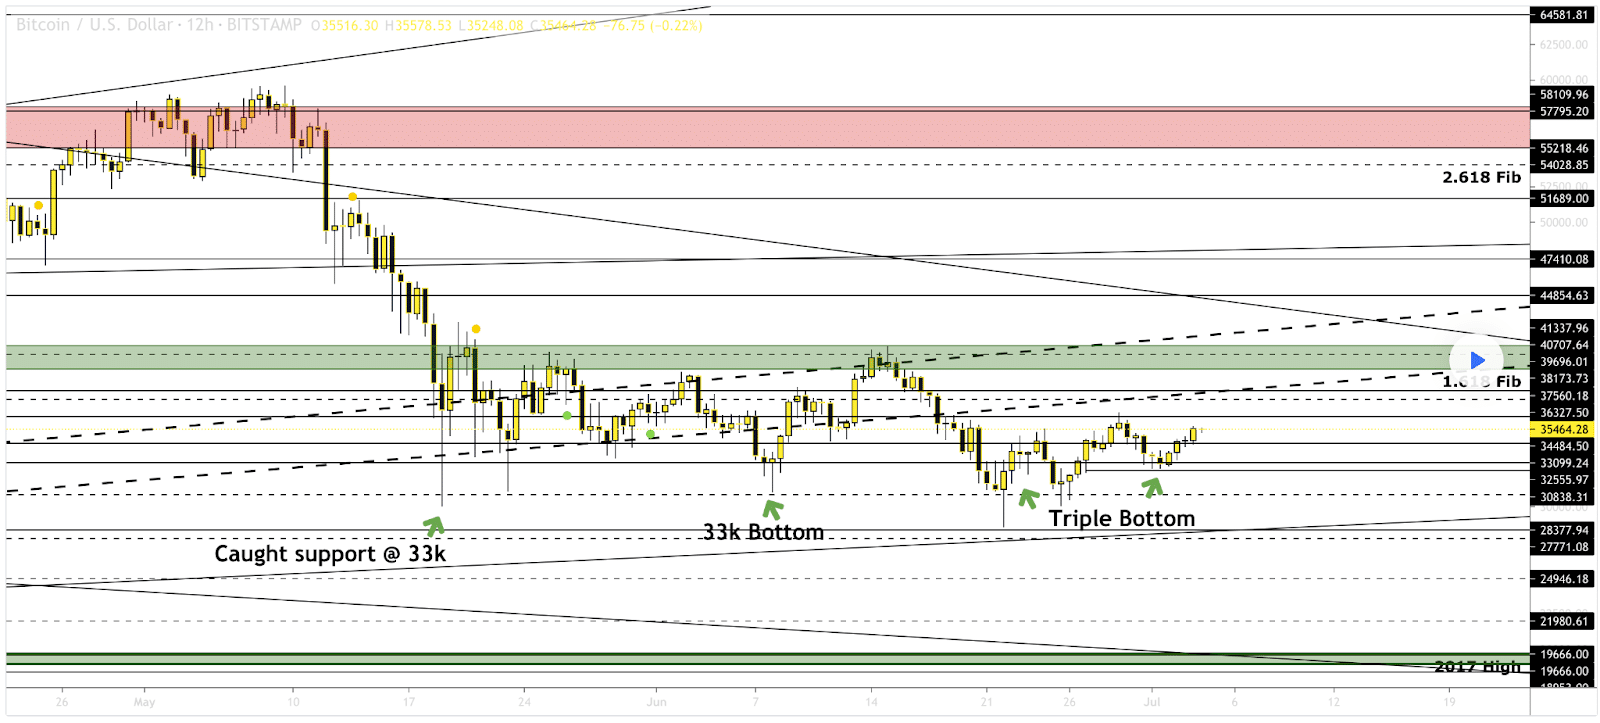
The below 12hr chart from kyer shows something that can only be interpreted as bullish momentum building. A triple bottom at $33k has formed and this is a very well known reversal pattern.

The Fear and Greed Index that tracks sentiment on bitcoin only is currently at 29 and +2 points from Saturday’s previous reading.
BTC’s 7 day range is $33,677-$35,968 which is a relatively narrow range for BTC volatility and particularly of late. The 52 week range on BTC is $9,004-$64,374.
Bitcoin closed the daily / weekly candle at $35,289 for a 3rd consecutive higher daily close.
Ethereum
Ethereum’s wait for BTC to turn the corner may or may not be over but Ether is already seizing the opportunity. ETH is well over $2k again and pushing towards the next target of $2,500. ETH is +5% for the last 24 hours at the time of writing and with EIP-1559 soon approaching Ether bulls are prepping for a lot of green candles.
Ether bears must hope that BTC [the macro] fails to break $41k and they can then push the Ether price beneath $2k once more.
Despite bitcoin’s historic ride to almost $65k this year over the last 12 months Ether has reigned supreme by percentage gained against the dollar by more than 500%. The ETH to BTC pair is also +163% for the last 12 months at the time of writing.
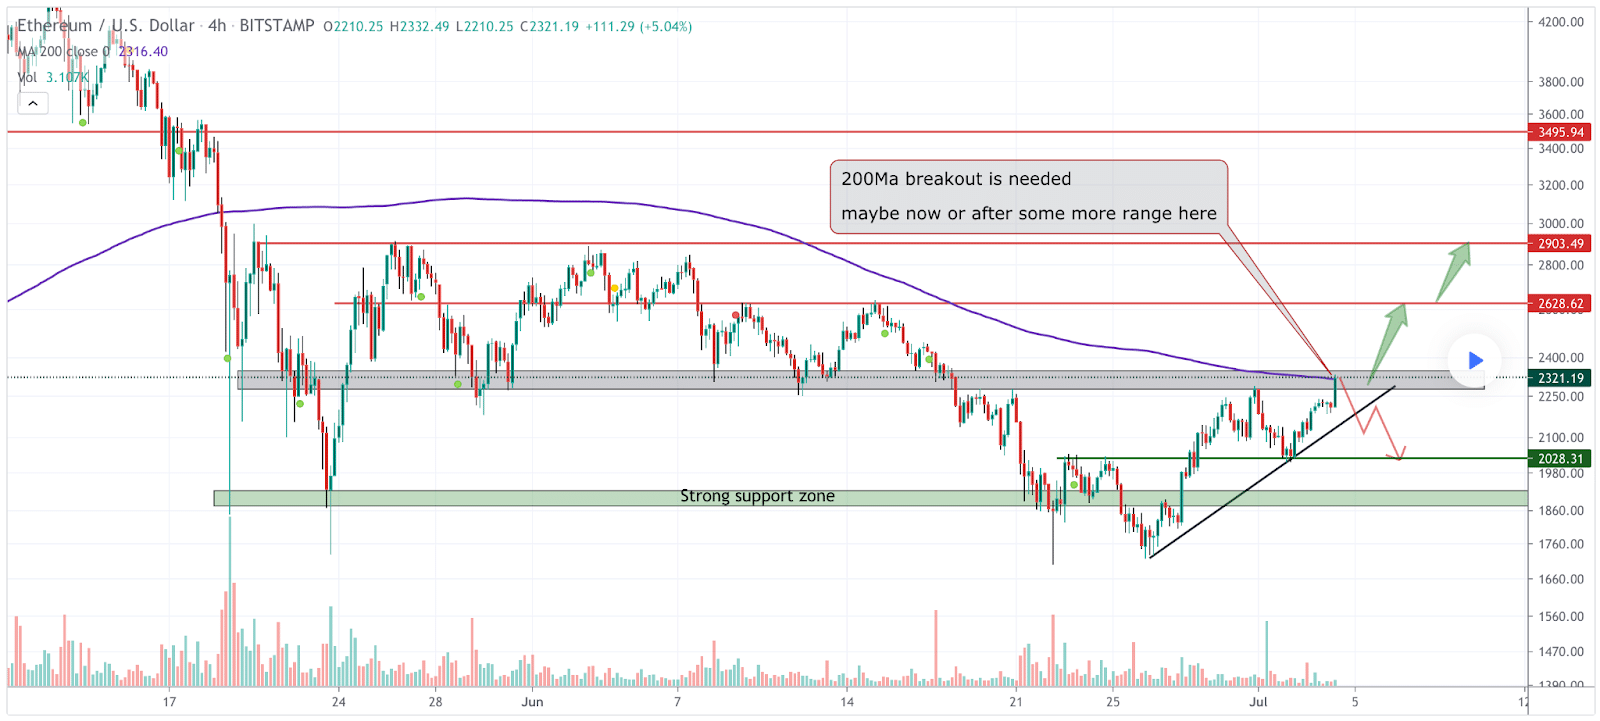
This 4hr chart from MMBTtrader shows a short term trend line dating back to June 26th that ETH has 2 and nearly 3 respective touches on since the first touch on June 26th.

If ETH can continue to respect that trend over the next week much higher prices may be forthcoming.
There’s however quite a bit of historical resistance looking left on the chart at $2,620 for bulls. If that resistance is broken $3k looks quite reasonable for bulls to shift their sights in the short term.
A contrary bearish scenario would look like a short term failure of the above trend line and a trip back below $2k and possibly back to the high $1,700s for another test of that region.
Ether’s 24hr range is $2,193-$2,387 and 7 day range is $1,973-$2,387.
Ether closed the daily / weekly candle on Sunday at $2,321 for its 3rd straight higher daily close.


