Bitcoin[+12.1%] can be attributed some blame for the poor performance amongst alts as BTC usurped further market cap dominance in anticipation of an important weekly close.
The aggregate crypto market capitalization is trading back above an important level [$1.3t] and is $1.56 trillion at the time of writing. Bitcoin dominance makes up 45.1% of the aggregate market cap while Ethereum accounts for 17.7%.
Bitcoin Price prediction
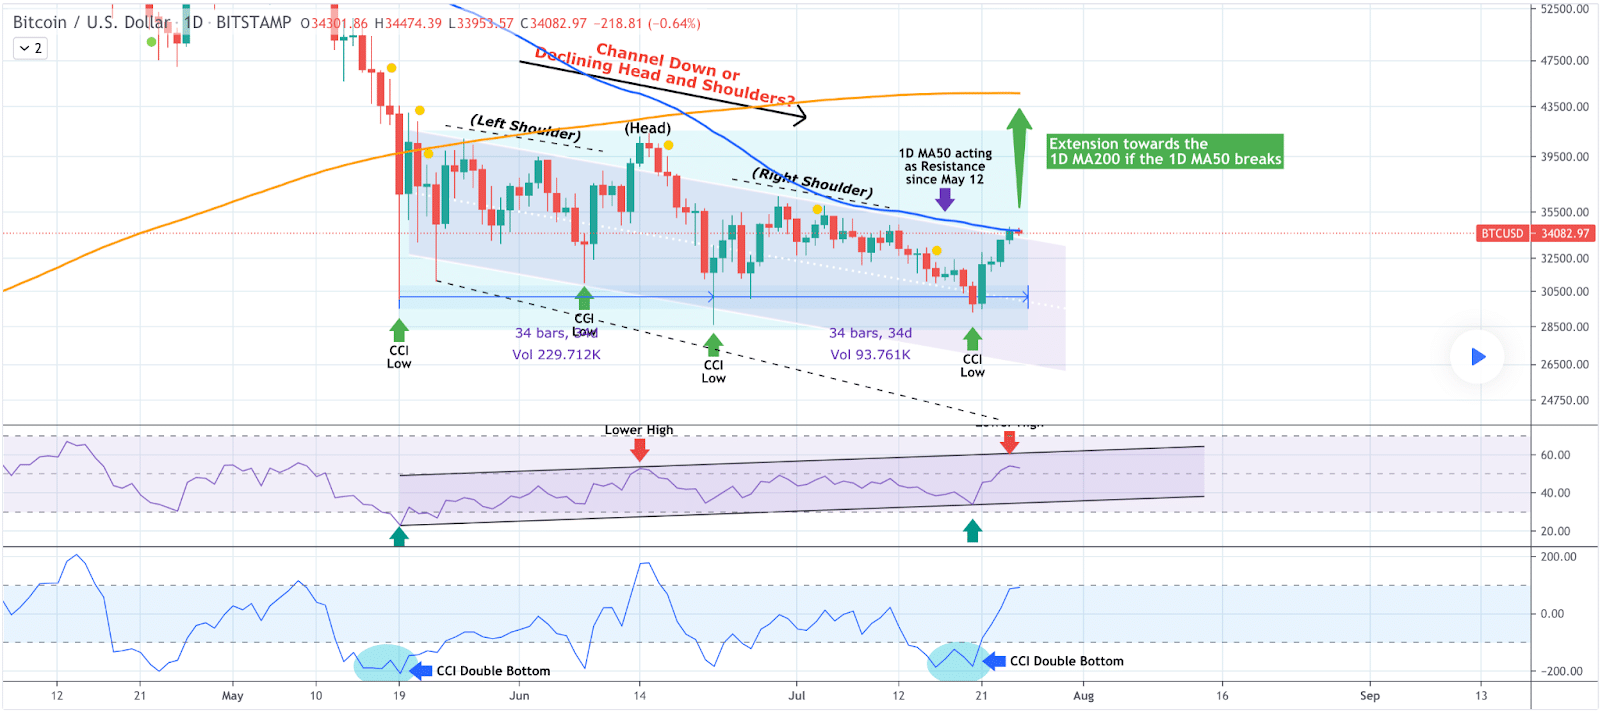
Bitcoin closed above the 1D MA50 that had been acting as resistance since May 12nd. The author of the chart below,TradingShot,believes the likelihood of higher prices with a close above that trendline is likely. The bitcoin price to the upside could see $44,594 which is the 1D MA200.
Bitcoin not only closed in green figures on Sunday but closed with a weekly bullish engulfing candle and +$1,145 on the day. With the context of this bullish engulfing candle being at such a critical level it can’t be overstated how important this victory was for bulls.

The top of the current range that BTC is in is $40k and the world’s premier asset is closer to the top of the range above $35k than below it at the time of writing.
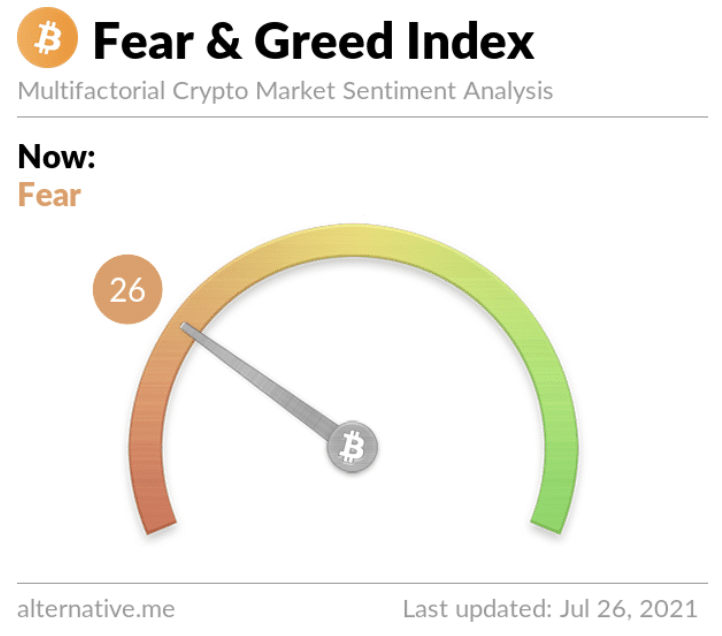
The Fear and Greed Index that measures sentiment on bitcoin across the market is at 26 and -1 from yesterday’s reading.

BTC’s 24 hour range is $33,886-$35,866 and the 7 day range is $29,599-$35,866. Bitcoin’s 30 day average price is $33,221.9. BTC was worth $9,651 on this date in 2020.
Bitcoin closed the daily / weekly candle on Sunday worth $35,407 and in green figures for a 5th consecutive day. Only 60 minutes into Monday’s daily candle BTC was already up as much as $3,600 with extreme follow-through price action to the upside acting as further confirmation for last week’s bullish engulfing candle. Bitcoin and the aggregate crypto market cap started the new week with prices not seen since mid-June.
Ethereum
Ethereum’s back over $2,100 but stalled out beneath $2,2k on Sunday. Ether [+1.83%] traded sideways for the bulk of Sunday but finished in green figures worth $2,190 for a 5th consecutive green candle close.

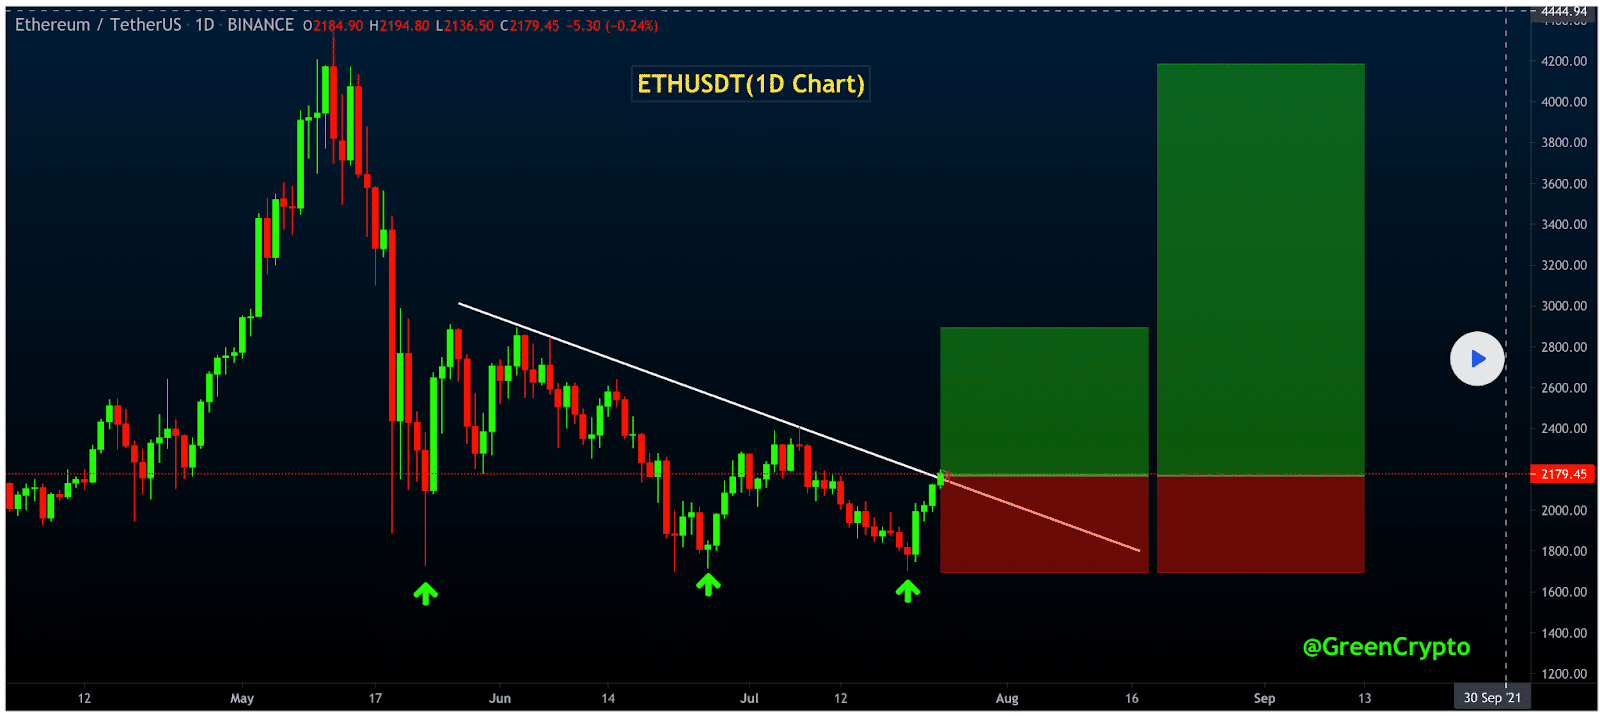
Despite trading sideways, Ether is still above the trendline on the 1D Chart shown below by GreenCryptoTrades.
Ether could mark up to $2,500 rather quickly with the macro sentiment shifting towards the bulls just over the last few days. If momentum does, however fail, a trip below the trendline could send prices back to the high $1,700s for a re-test of that level.
Ether’s 24 hour range is $2,108-$2,230 and the 7 day range is $1,734-$2,230. ETH’s 30 day average price is $2,061.12.


