Bitcoin Analysis
Bitcoin’s price action traded sideways for the bulk of its daily candle until it reached the afternoon session on Monday.
The price dipped during the final two 4hr candles left in the day to a daily session low of $46,903 just minutes before the close.
The trend continues of bitcoin reaching daily highs or lows regardless of bullish or bearish price action heading into the daily candle close.
Bitcoin’s technicals are a bit of a mixed bag right now.
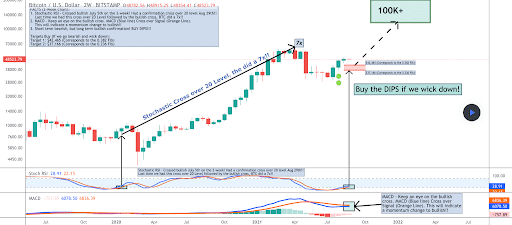
The 2W chart below from jaydee_757 shows the stochastic crossover of the 20 level on bitcoin.
The last time BTC crossed over this level it did a 7x. This crossover occurred on August 29th and traders may interpret this as a hyper-bullish signal of things to come for bitcoin’s price in the coming months.

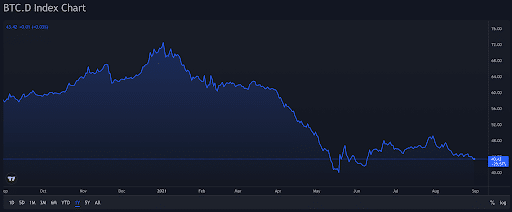
Bitcoin dominance is however in a bit of a downtrend currently and could be heading back down to test the 40% level. BTC dominance currently accounts for 41.6% of the aggregate crypto market capitalization of $2.12 trillion.

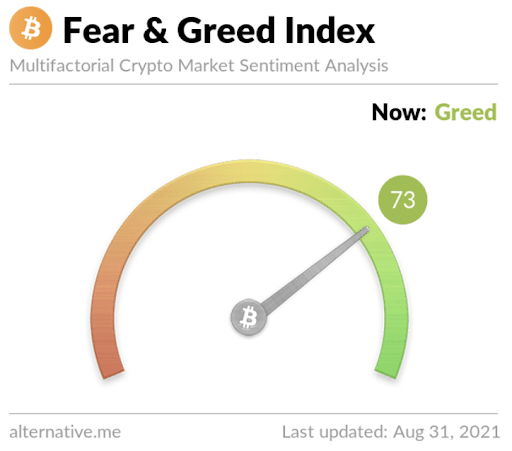
The Fear and Greed Index is 73 and equal to yesterday’s reading of ‘Greed.’
BTC’s 24 hour range is $46,903-$49,432 and the 7 day price range is $46,774-$49,710. Bitcoin’s average price for the last 30 days is $45,449.


Bitcoin closed Monday’s daily candle worth $47,008 and -3.67%.
Ethereum Price Analysis
Ether’s price finished +0.21 % on Monday and could be poised for further upside in the coming days after two weeks of consolidation. Bitcoin and the macro outlook is a bit gloomy in the interim but the fact that Ether managed to finish in green figures on a day where BTC dropped a significant amount is a testament to its relative strength.
As you can see below on the 1D Ether chart from kevvela ETH’s been consolidating in this current range since August 6th. The longer an asset chops and consolidates in a tight region the probability increases exponentially that a powerful move may be forthcoming.
Bulls will want to keep the price above the current trendline on the 1D chart at $3,135. If bears can push the price down and out of this formation the potential bullish move upwards in the short-term will be invalidated. If bears do succeed in breaking $3,135 then $3k is the next level for Ether bulls to defend.
If bulls can break $3,336 a trip to the high $3k level and a test of $4k could be imminent.
ETH’s 24 hour range is $3,143-$3,347 and the 7 day range is $3,092-$3,347. Ether’s 30 day average price is $3,051.
Ether closed Monday’s daily candle worth $3,228 and in green figures for the first time in three days.


