Summary
Bitcoin Analysis
Bitcoin’s price action over the weekend resembled its price action for much of the last month and continues to churn.
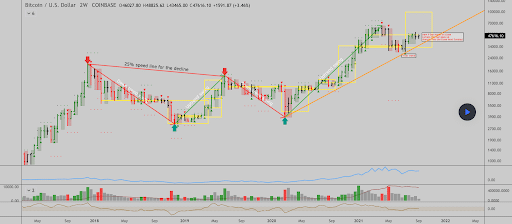
The below 2W chart from Ivan Labrie shows a long time ascending trendline being respected by BTC’s price. There are a lot of signals pointing to further sideways price action until the end of September for Bitcoin.

As long as Bitcoin’s price holds above the $46,5k level bulls will probably remain confident. Below that price level traders may be more inclined to believe downside is forthcoming.
The Bitcoin charts overall have been very ambiguous lately and there’s not much of an edge for bulls or bears. After these lulls is generally when traders can expect a major move up or down and the bi-weekly timeframe has been a good historical tool to analyze what’s coming next for market participants.
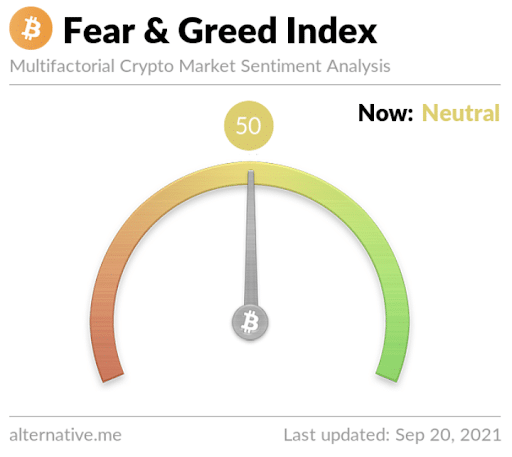
The Fear and Greed Index is 50 and -3 from yesterday’s reading of 53 that was also in the Neutral zone.

BTC’s 24 hour price range is $46,943-$48,442 and the 7 day price range is $44,031-$48,852. Bitcoin’s 52 week price range is $10,255-$64,374.
BTC’s average price for the last 30 days is $48,039.
Bitcoin’s still the #1 cryptocurrency by market capitalization with 40.6% market dominance and a $889 billion market capitalization.
Sunday’s daily and weekly candle close for bitcoin was $47,239. BTC closed the daily candle [-2.21%] in red digits and the weekly candle also closed in red digits [-2.53%].
Ethereum Price Analysis
Ether’s price suffered from the dearth of positive price action out of the macro over the weekend. ETH’s trading back below $3,5k which is an important region for bulls to leave behind and signify control again.
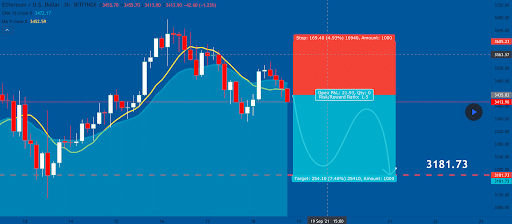
The 3hr chart below from United Signals shows the likelihood of Ether retesting the bottom of its range again at $3,181.73 with sustained price action beneath $3,5k.

ETH bulls really need to reclaim territory above the $3,5k level or $3k could be tested eventually.
Ether’s 24 hour price range is $3,294-$3,456 and the 7 day price range is $3,192-$3,655. ETH’s 52 week price range is $320-$4,352.
ETH’s 30 day average price is $3,433. ETH boasts the #2 ranked cryptocurrency by market capitalization of $391.1 billion with 17.9% market share of the aggregate crypto market cap of $2.18 trillion.
Ether [-3.14%] closed Sunday’s daily candle worth $3,328 and in red figures. ETH also closed the weekly timescale in red digits and -4.38% after finishing in green digits the week prior.
Avalanche Price Analysis
Avalanche is knocking on the door of the Top Ten projects by market capitalization and is trending upward while the majority of large market cap projects are a bit stagnant.
Avalanche is +504.5% against The U.S. Dollar over the last 90 days, +311% against BTC, and +253.7% against ETH over that same timespan.

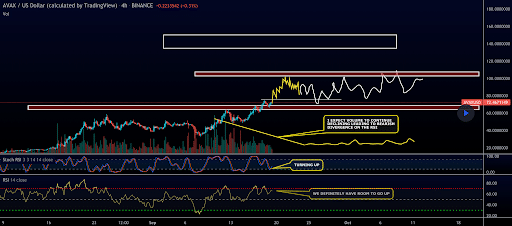
The chart above from Mboersma0324 shows AVAX currently holding the top of a strong support resistance at $68. The depth of that level is as low as $62 and above that price level bulls are still in charge.
If bulls can break over head resistance at the $75 level then bullish traders will be targeting the $100-$102 level.
AVAX’s 24 hour price range is $67.2-$75.28 and the 7 day price range is $49.9-$75.28. Avalanche’s 52 week price range is $2.82-$76.27.
Avalanche’s average price for the last 30 days is $50.33. AVAX is the #11 cryptocurrency project with a market capitalization of $14.98 billion.
AVAX [+1.63%] closed its daily and weekly candle on Sunday worth $70.02 and in green figures. Avalanche’s weekly candle closed in red figures and -1.2%.


