Summary
Bitcoin back above $50k
Bitcoin’s price has found some relief over the last two days as demand from buyers once again outweighed selling pressure from bearish traders on Monday. BTC’s price finished the daily timescale on Monday +$1,097.6 and once again above the $50k level.
The BTC/USD 1W chart below from Babenski allows traders to visualize how close to the ‘2021 bullrun trendline’ BTC’s price was on the most dramatic wick down of its current downtrend.
The gist of the chart below is that if BTC’s price breaks the $40k level and its price gets a candle close below that level on the weekly time frame, the bull market could indeed be over.

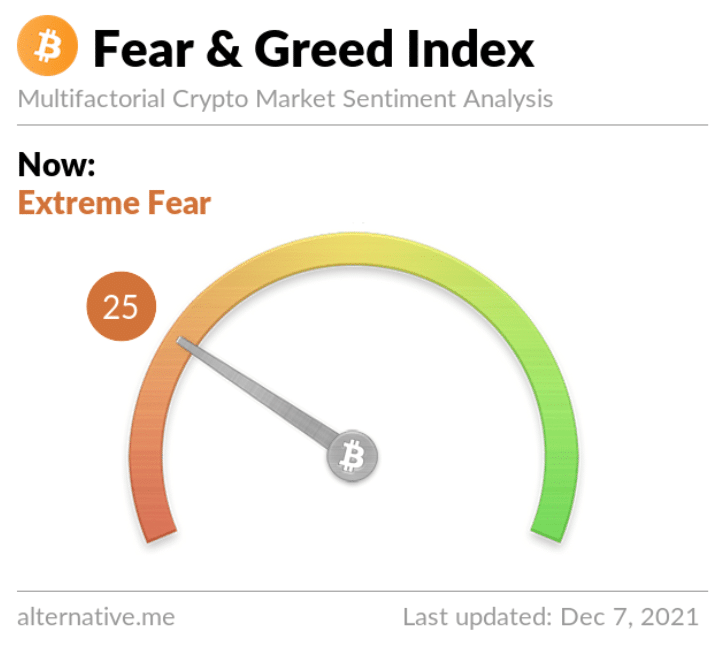
The Fear and Greed Index is 25 Extreme Fear and +9 from yesterday’s reading of 16 Extreme Fear.

Bitcoin’s price is still trading below all important moving averages but the 200 Day MA. Bitcoin’s moving averages are as follows, at the time of writing: 20 Day MA [$58,069.03], 50 Day MA [$58,246.48], 100 Day MA [$51,222.12], 200 Day MA [$48,804.29].
BTC’s 24 hour price range is $47,243-$50,179 and its 7 day price range is $46,633-$58,612. Bitcoin’s 52 week price range is $17,764-$69,044.
The price of bitcoin on this date last year was $19,325.
The average price of BTC for the last 30 days is $58,977.
Bitcoin [+2.22%] closed its daily candle worth $50,566 and in green figures on Monday for the second day in a row.
Ethereum Analysis
Ether’s price also continued its rally on Monday and finished its daily candle +$158.06.
The ETH/USD 1W chart below bearofwallst illustrates how critical the $4k level is on the 1W chart. If bulls lose this trend line, the potential for a steeper pullback can’t be discounted.
After relinquishing ground for months, bearish traders have seized short-term momentum and now have a shot to extend a bearish downtrend.

ETH’s 24 hour price range is $3,941-$4,379 and its 7 day price range is $3,828-$4,770. Ether’s 52 week price range is $541.28-$4,878.26.
The price of ETH on this date in 2020 was $592.39.
The average price of ETH for the last 30 days is $4,408.
Ether [+3.77%] closed its daily candle on Monday worth $4,352 and in green figures for the second straight day.
AVAX Analysis
AVAX’s price rallied on Monday to close the daily time frame +$7.19 but still closed the day -35.64% from it’s all-time high of $144.96.
The AVAX/USD 1D chart below from trieutv shows the most critical levels for AVAX bulls and bears.
For bulls, they’re looking to reclaim and hold the 1.382 [$98.09] and push AVAX’s price back to test its all-time high at the 1.618 [$146.70].
Conversely, bearish traders are trying to push AVAX’s price back down to the 1 fib level [$51.13]. If bears succeed there, they’ll set their sights on a secondary target below of the 0.786 [$35.49].

AVAX’s 24 hour price range is $77.54-$94.95 and its 7 day price range is $77.96-$126.3. Avalanche’s 52 week price range is $2.82-$144.96.
AVAX’s price on this date last year was $3.38.
The average price for Avalanche over the last 30 days is $104.27.
AVAX [+8.35%] closed its daily candle on Monday worth $93.29 and in green figures for the first time in three days.


