
Summary
Bitcoin trading
Bitcoin’s price traded in red figures on Wednesday and closed -$130.6 for its daily candle.
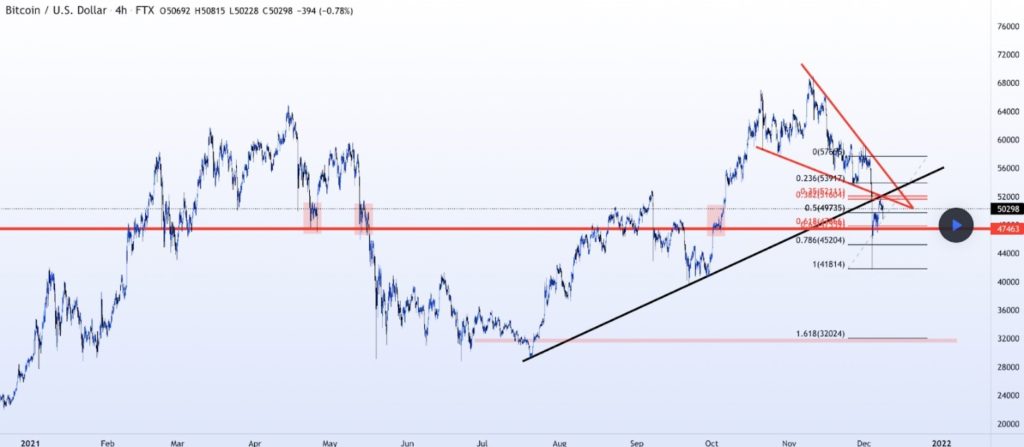
The BTC/USD 4hr chart below from gautuwuu shows that BTC’s price is trading within a descending triangle, at the the time of writing.
The most integral fibonacci level for BTC bulls to control on this timescale in the interim is 0.5 [$49,735] which is currently acting as support. Overhead targets for bullish traders are 0.382 [$51,604] and 0.236 [$53,917].
Bearish traders conversely are seeking to break the 0.5 fib level [$49,735], then proceed to accomplish a 4hr and then daily close below that level to flip it from support for bulls to resistance. Below the 0.5 fib bears are aiming for 0.618 [$47,866] with a third target of 0.786 [$45,204].
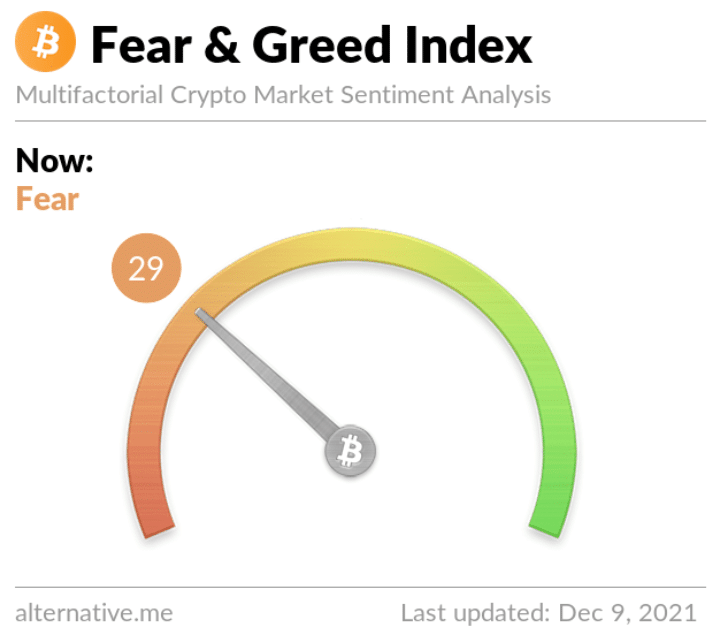
The Fear and Greed Index is 29 and +1 point from yesterday’s reading of 28 Fear.
One aspect outside of bitcoin’s charts and technical analysis to consider is the expiration of bitcoin option contracts set to expire on Friday worth $1.1 billion. There currently appears to be an imbalance of contracts favoring bearish BTC traders to the tune of around $300 million in theoretical profits.
Bitcoin’s price is trading below all important moving averages but the 200 Day MA, at the time of writing. BTC’s 20 Day MA [$57,372], 50 Day MA [$58,432], 100 Day MA [$51,407], 200 Day MA [$48,801].
BTC’s 24 hour price range is $48,934-$51,319 and its 7 day price range is $46,633-$57-244. Bitcoin’s 52 week price range is $17,764-$69,044.
The price of bitcoin on this date last year was $18,564.
The average price of BTC for the last 30 days is $57,688.
Bitcoin [-0.26%] closed its daily candle worth $50,503 and in red figures for the day while breaking its streak of two straight daily closes in green figures.
Ethereum Analysis
Ether’s price is only -4.3% for the weekly timescale at the time of writing despite BTC’s price trading over 11% in the red for the same duration. ETH continued to outperform BTC on Wednesday and closed its daily candle +$28.23.
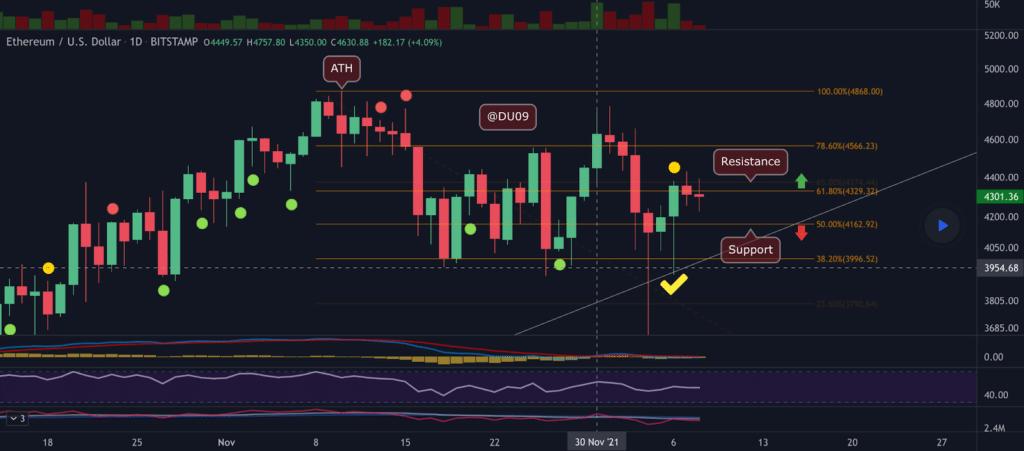
The ETH/USD 1D chart below DU09 shows the importance of 61.8% fib level [$4,329.32] for bullish traders in the short-term. Two targets overhead for bulls to reach on their way back to ETH’s all-time high of $4,878 are 78.6% [$4,566.23] and 100% [$4,878].
Bearish ether traders however are looking to break the 61.8% fib level and then send ETH’s price down to break its current trendline at 50.0% [$4,162.92]. If they’re successful with a breakout to the downside, 38.20% [$3,996] will be the next target for bears to snap in their pursuit of lower prices.
Ether’s price is trading above all of important moving averages, at the time of writing. ETH’s 20 Day MA [$4,360], 50 Day MA [$4,167], 100 Day MA [$3,624], 200 Day MA [$2,991].
ETH’s 24 hour price range is $4,251-$4,477 and its 7 day price range is $3,828-$4,619. Ether’s 52 week price range is $541.28-$4,878.
The price of ETH on this date in 2020 was $560.45
The average price of ETH for the last 30 days is $4,385.
Ether [+2.97%] closed its daily candle on Wednesday in green digits for the third time in the last four days.
Chainlink Analysis
Chainlink’s price is respecting a historical trendline dating back to June 2020 and has bounced off of that level to the upside. LINK’s price finished Wednesday’s daily candle +$1.83 and has responded positively upon news that Google’s former CEO, Eric Schmidt, has been brought on as a Strategic Advisor to Chainlink Labs.
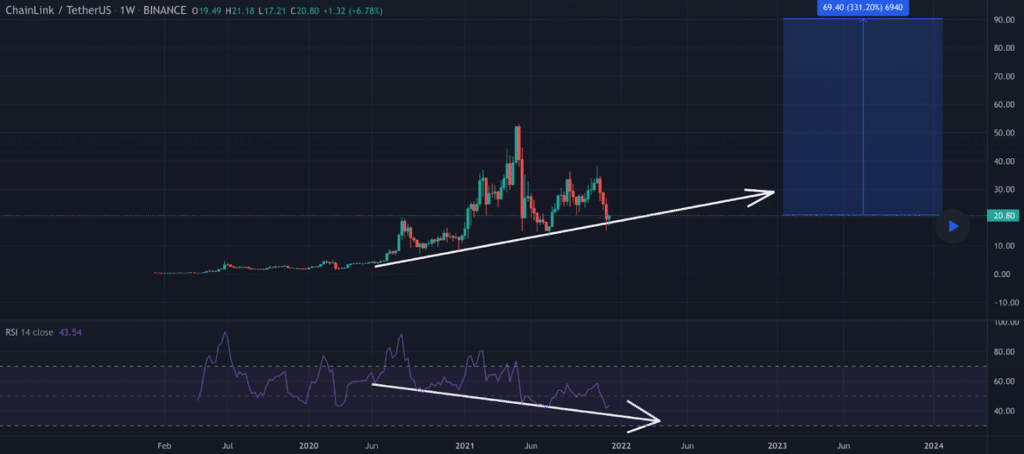
The LINK/USD 1W chart below from Ganbu shows extremely steep bullish divergence for LINK on this time frame.
LINK bulls will hope the emerging divergence marks the bottom of Chainlink’s downtrend on the RSI and also that it marks a reversal to the upside. If bulls can again send LINK’s RSI back above 65 and then 80, where it was during its sizzling hot summer run of 2020, then it has a chance to again break 90 and test 92 where it peaked during that summer.
Despite the positive price action over the last 72 hours, LINK’s price is still trading below all important moving averages, at the time of writing.
LINK’s moving averages are as follows: LINK 20 Day MA [$25.98], 50 Day MA [$27.93], 100 Day MA [$26.66], 200 Day MA [$27.85].
LINK’s 24 hour price range is $20.89-$23.15 and its 7 day price range is $17.61-$25.67. Chainlink’s 52 week price range is $9.02-$52.7.
LINK’s price on this date last year was $12.66.
The average price for LINK over the last 30 days is $26.97.
Chainlink [+8.69%] closed its daily candle in green figures on Wednesday for a third straight day.