
")
Summary
Bitcoin Analysis
Bitcoin’s price traded sideways for the bulk of Sunday’s daily candle and closed its daily session +$15.
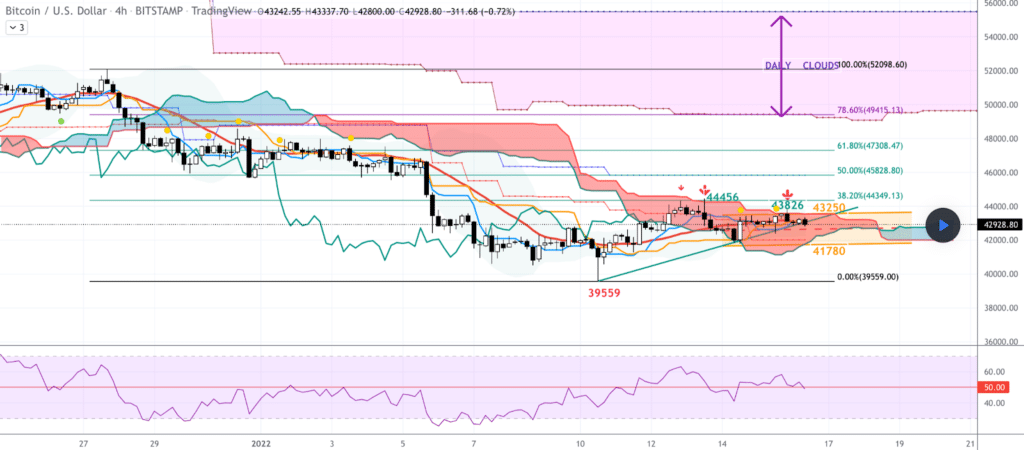
The BTC/USD 4HR chart below from Ironman8848 shows the levels that BTC traders are watching closely in the short term.
Overhead bullish BTC traders are trying to crack the 38.20% fib level [$44,349] with a secondary target of the 50.00% fib level [$45,828.8]. If bullish traders can send bitcoin above the $45k level and break the 50.00% fib level then the third target above is 61.80% [$47,308.47].
Bearish bitcoin traders have other intentions and are trying to once again send BTC’s price back down to test a major level of inflection at $40k. If bullish BTC traders are able to break the $40k level then the next stop is a full retracement at 0.00% [$39,559.].
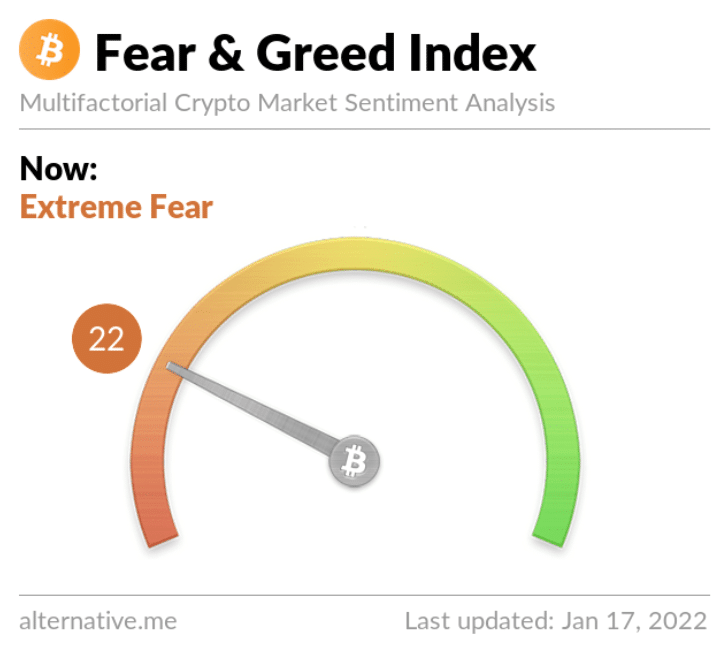
The Fear and Greed Index is 22 Extreme Fear and +1 from yesterday’s reading of 21 Extreme Fear.
Bitcoin Moving Averages: 20-Day [$46,076.05], 50-Day [$52,052.57], 100-Day [$52,336.62], 200-Day [$47,528.12], Year to Date [$43,524.55].
BTC’s 24 hour price range is $42,739-$43,570 and its 7 day price range is $40,683-$44,142. Bitcoin’s 52 week price range is $28,991-$69,044.
The price of bitcoin on this date last year was $35,804.
The average price of BTC for the last 30 days is $44,859.
Bitcoin’s price [+0.03%] closed its daily candle worth $43,084 and in green figures again after closing in red figures for Saturday’s daily session.
Ethereum Analysis
Ether’s price finished its daily candle on Sunday +$18.39 and in green digits for a third straight daily candle close.
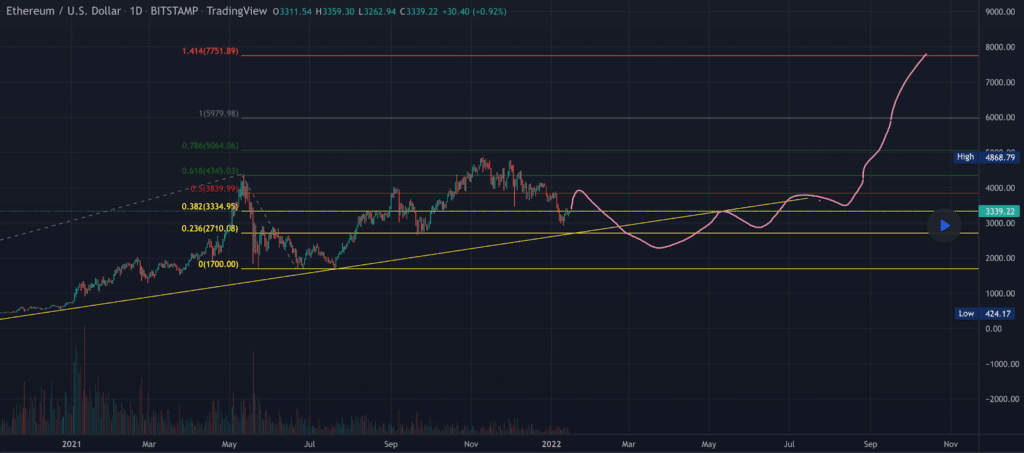
Today we’re looking at the ETH/USD 1D chart below from God-of-crypto. Ether bulls showed some promise this week and are trying to again break the 0.382 fib level [$3,334.95] with a secondary target of 0.5 [$3,839.99]. The 0.618 fib level [$4,345.03] is the third overhead target for bullish Ether market participants.
Bearish ETH traders are hoping to again deny a breakout above the 0.382 and send ETH’s price back down to test the bottom of its current range at the 0.236 [$2,710.08].
Ether’s Moving Averages: 20-Day [$3,659.33], 50-Day [$4,052.23], 100-Day [$3,842.41], 200-Day [$3,235.58], Year to Date [$3,403.34].
ETH’s 24 hour price range is $3,298-$3,386 and its 7 day price range is $3,011-$3,395. Ether’s 52 week price range is $1,110-$4,878.
The price of ETH on this date in 2020 was $1,129.
The average price of ETH for the last 30 days is $3,645.
Ether’s price [+0.55%] closed its daily candle on Sunday worth $3,346.
Chainlink Analysis
The third project we’re examining today is Chainlink. Chainlink’s price is again trading above the 20 Day and 50 Day Moving Averages and finished Sunday’s daily session +$.32.
LINK’s been one of the strongest performers in all of crypto over the last month and began a new uptrend after consolidation in the high teens late last year.
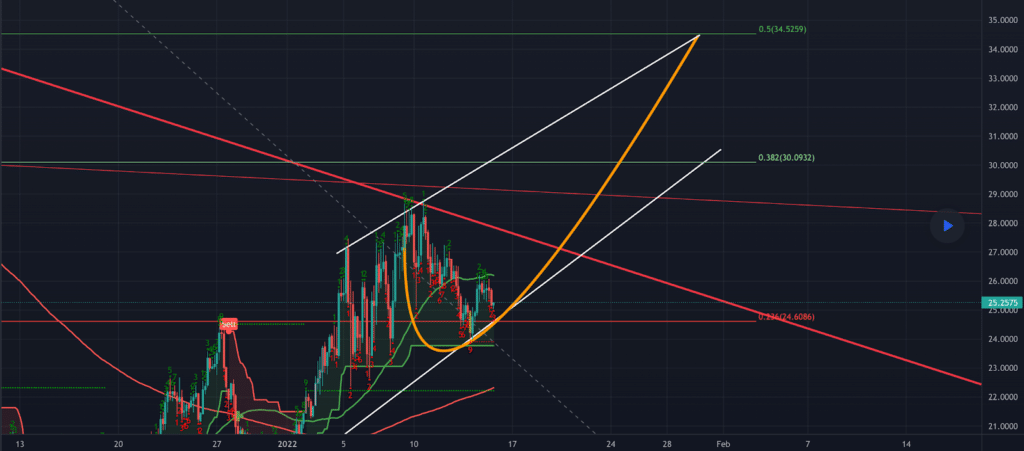
The LINK/USD 1D chart below from Brother-Doug shows strong support for bullish LINK traders at the 0.236 fib level [$24.60]. Above that level is local overhead resistance at $28 and then the 0.382 fib level [$30.09]. If bullish LINK traders break the 0.382 the next stop above is 0.5 [$34.52].
Bearish LINK market participants are conversely trying to snap the strong support bulls have recently enjoyed at the $24 level and then send LINK back down to test the high teens again.
Chainlink’s Moving Averages: 20-Day [$22.99], 50-Day [$24.55], 100-Day [$26.09], 200-Day [$26.86], Year to Date [$25.40].
LINK’s +40.88% for the last 30 days against The U.S. Dollar, +51.64% against BTC, and +62.9% against ETH, at the time of writing.
LINK’s 24 hour price range is $24.92-$26.28 and its 7 day price range is $24.16-$28.48. Chainlink’s 52 week price range is $13.43-$52.7.
LINK’s price on this date last year was $23.30.
The average price for LINK over the last 30 days is $22.91.
Chainklink’s price [+1.27%] closed its daily session on Sunday worth $25.50 and has been alternating between green and red daily candle closes for the last seven days.