Summary
Bitcoin rally
Bitcoin’s price rallied on Sunday to put an end to a week of incessant selling pressure from bearish traders and finished Sunday’s daily session +$1,205. Despite Sunday’s solid effort from bullish traders, BTC’s price finished the week -16.5%.
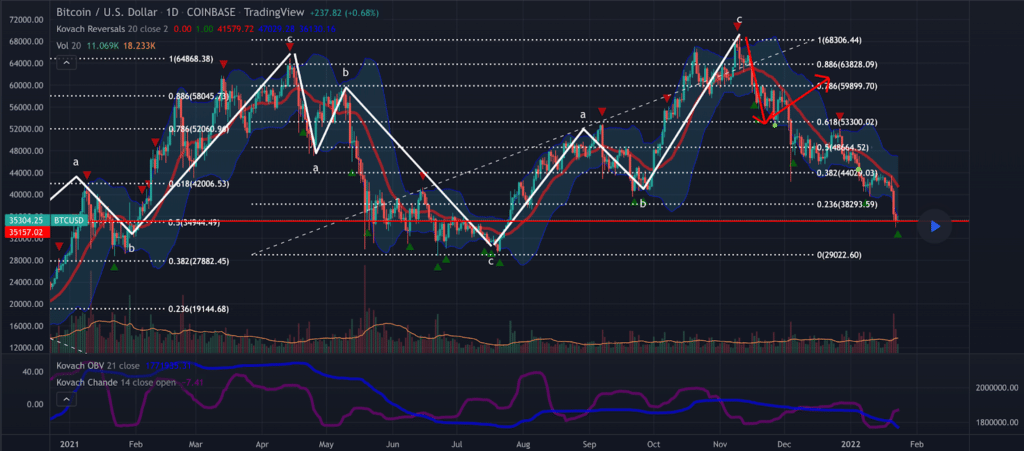
The BTC/USD 1D chart below from quantguy is the first chart we’re analyzing today. Bullish BTC traders are hoping to reverse course before a full retracement at 0 [$29,022.6]. If bulls can reverse BTC’s price action to the upside, the first overhead fib level to crack is 0.236 [$38,293.59] with a secondary target of 0.382 [$44,029.03].
From the bearish perspective they’re trying to crack the $30k level and then push BTC’s price below the $29k level. A secondary target for bearish BTC market participants is 0.382 [$27,882.45].
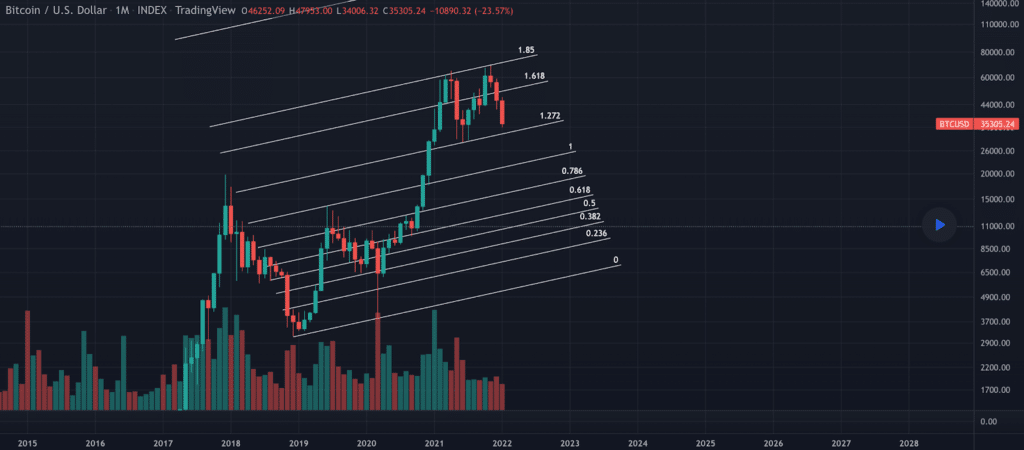
The second BTC chart we’re examining today is the BTC/USD 1M chart from Sanmig_Live. We can see that bearish traders are trying to break the 1.272 fib level [$32,654] with 1 [$22,262.65] as the next target.
Bullish BTC traders conversely are hoping to bounce before or off of the 1.272 and again try to reclaim the 1.618 [$50,247.71]. The 1.85 [$70,257.27] is the next overhead target for BTC bulls if they crack the 1.618 which would take BTC’s price back up again to test the all-time high of $69,044.
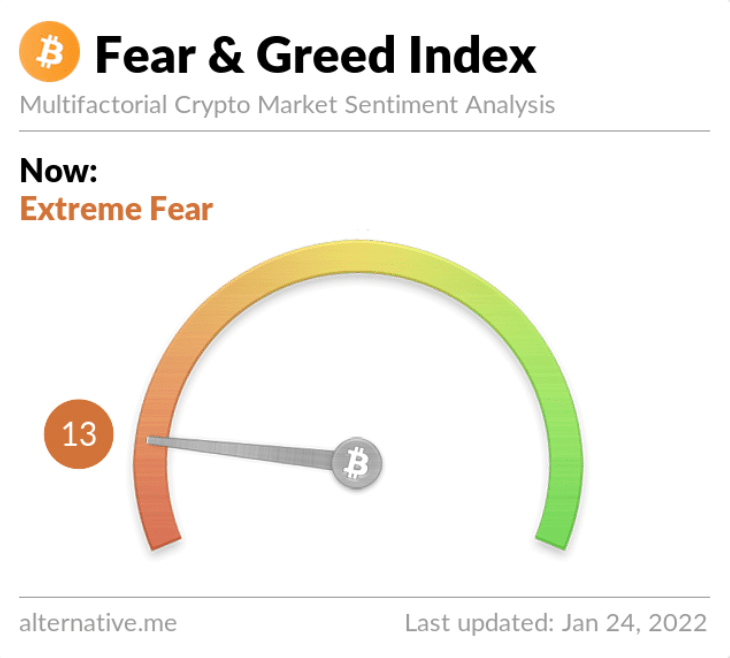
The Fear and Greed Index is 13 Extreme Fear and +2 from Sunday’s reading of 11 Extreme Fear.
BTC’s 24 hour price range is $34,804-$36,363 and its 7 day price range is $34,527-$43,308. Bitcoin’s 52 week price range is $29,341-$69,044.
The price of bitcoin on this date last year was $32,068.
The average price of BTC for the last 30 days is $44,193.
Bitcoin’s price [+3.43%] closed its daily candle worth $36,308 and in green figures for the first time in five days.
Ethereum Analysis
Ether’s price rallied as well on Sunday and finished its daily session +$127.97.
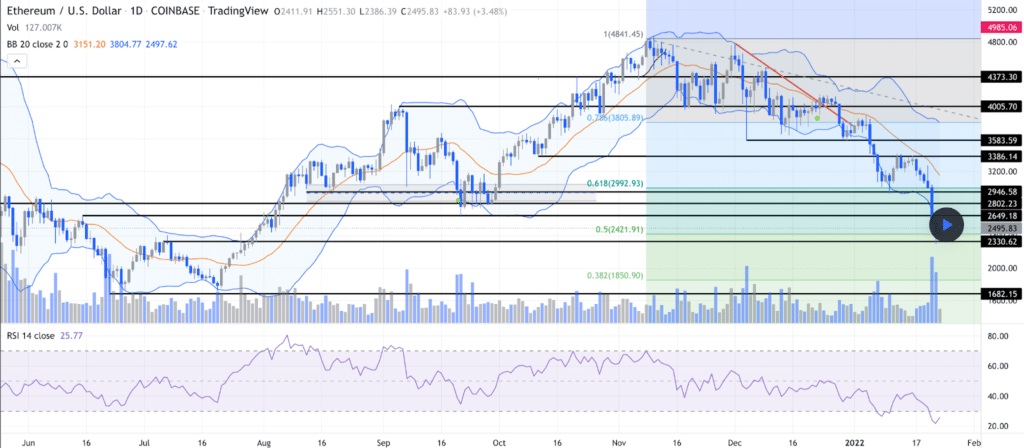
The ETH/USD 1D chart below from WhiteCollarDad shows the most important levels on the daily timescale currently for Ether market participants.
Bullish Ether traders are hoping they can hold the 0.5 fib level [$2,421.91]. If they can hold that level and send ETH’s price higher there, they’ll set their sights overhead again on the 0.618 fib level [$2,992.93].
The bearish perspective looks much different since cryptocurrencies are highly momentum driven assets – bears are currently in the driver’s seat and attempting to break the 0.5 fib level and send ETH’s price lower. If bears can close the daily timescale below the 0.5 fib the next target to the downside is 0.382 [$1,850.90].
ETH’s 24 hour price range is $2,383-$2,562 and its 7 day price range is $2,343-$3,353. Ether’s 52 week price range is $1,233-$4,878.
The price of ETH on this date last year was $1,392.
The average price of ETH for the last 30 days is $3,420.
Ether’s price [+5.3%] closed its daily candle on Sunday worth $2,540.45 and in green digits for the first time in seven days.
Dogecoin Analysis
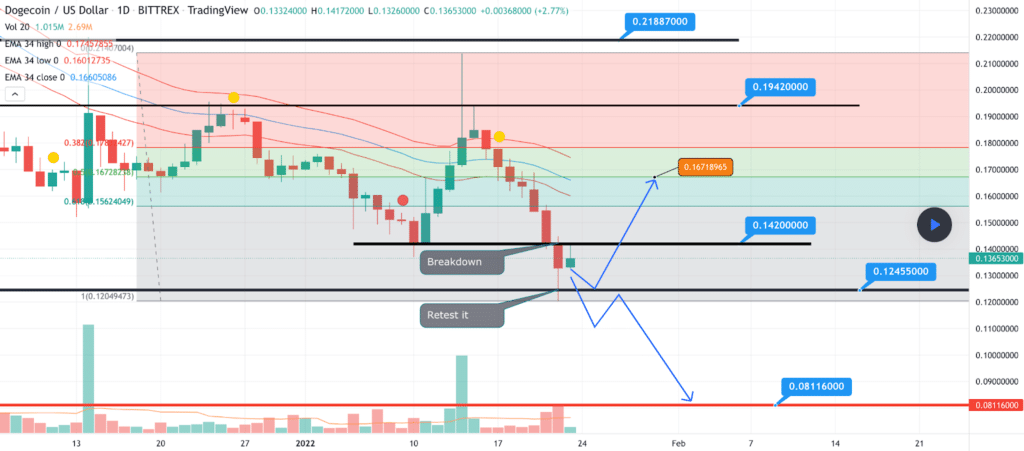
Dogecoin price bounced with the aggregate market on Sunday and closed its daily candle +$.008.
The DOGE/USD 1W chart below from kamalzakhoy shows DOGE retesting a critical support level and the last line of defense above single digit pennies at 1 [$0.12]. If bearish traders are able to take bullish DOGE traders into even deeper waters the next support level is back under a dime and at the $0.08 level.
However, if bulls have their way in the short term and can rally above or off of support at $0.12, their overhead target above is $0.14 before a larger test at the secondary target of the .618 fib level [$0.156].
DOGE’s 24 hour price range is $.13-$.143 and its 7 day price range is $.125-$.178. Dogecoin’s 52 week price range is $.007-$.725.
Dogecoin’s price on this date in 2021 was $.008.
The average price for DOGE over the last 30 days is $.166.
Dogecoin’s price [+6.23%] closed its daily session worth $.141 and in green figures for the first time in eight days.


