Summary
Bitcoin, a day of volatility
Bitcoin’s price closed its daily session on Wednesday -$163.2. and reversed course after it appeared like it was heading north to test the $40k level again.
Market sentiment stalled out at a session high of $39,216 however during Federal Reserve Chairman Jerome Powell’s update on the Federal Reserve’s policy moving forward. During the Fed’s January meeting and after the meeting the market volatility picked up massively and Bitcoin’s price reached its daily session low of $36,354 during the day’s final 4 hour candle.
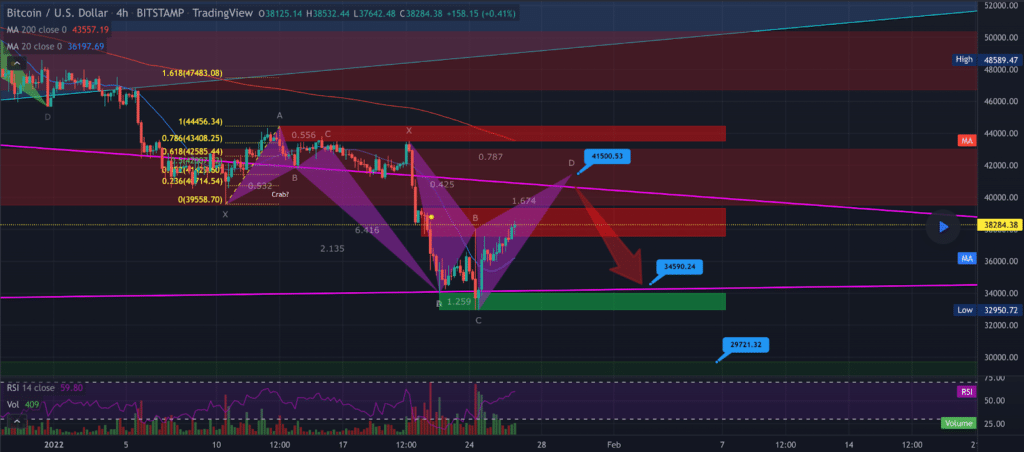
The first chart we examine today is the BTC/USD 4HR chart below by Akamer-the-Werewolf. The price of BTC is currently trading between the $34,590 level and the 0 fib level [$39,558.7]. If bullish BTC market participants can overcome the 0 fib level and $40k, the next overhead resistance for BTC bulls is the 0.236 fib level [$40,714.54].
Conversely, bearish BTC traders are aiming to send BTC’s price back down to the $34,5k level with a secondary target at $29,721.32. The secondary target is the bottom of BTC’s price after BTC’s top at $65k during 2021. If the $29k level is broken, bears will surely be looking to incite a great deal of further damage to the downside of the charts.

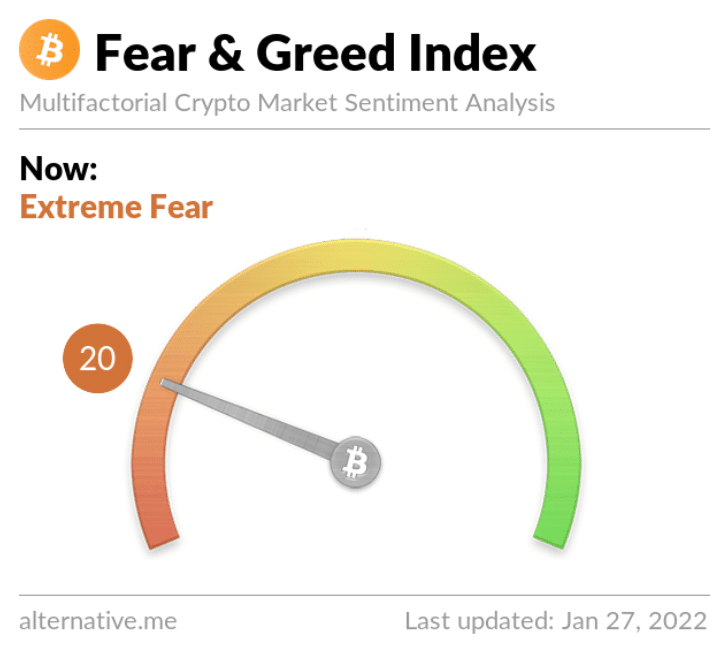
The Fear and Greed Index is 20 Extreme Fear and -3 from Wednesday’s reading of 23 Extreme Fear.

Bitcoin’s Moving Averages: 20-Day [$41,608.05], 50-Day [$47,674.96], 100-Day [$51,495.03], 200-Day [$46,630.12], Year to Date [$41,359.54].
BTC’s 24 hour price range is $36,354-$39,216 and its 7 day price range is $33,505-$43,308. Bitcoin’s 52 week price range is $29,341-$69,044.
The price of bitcoin on this date last year was $30,445.
The average price of BTC for the last 30 days is $42,925.
Bitcoin’s price [-0.44%] closed its daily candle worth $36,830.8 and in red digits for the first time in four days.
Ethereum Analysis
Ether’s price was up more than 10% on Wednesday before it also sold-off following the conclusion of the Fed’s January policy meeting. ETH closed its daily session +$3.03.
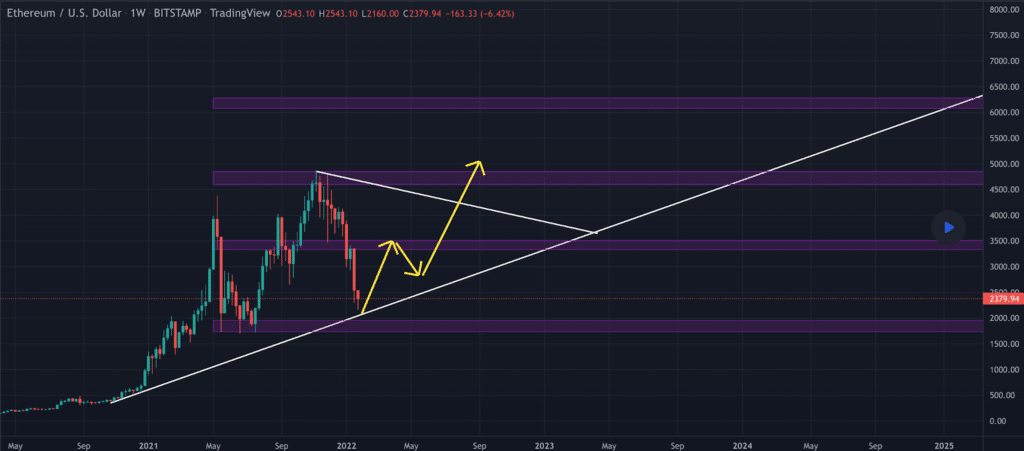
The second chart we’re looking at today is the ETH/USD 1W chart below from trade724_app. Traders will note that ETH’s price on the weekly timescale has backtested a long term trendline dating back to late 2020.
Bullish Ether traders defended that trendline on the weekly time frame and have rallied intraweek. The next level of overhead resistance is at the $3,3k level for bullish ETH traders. If they eclipse that level they’re then attempting to climb back above the $4k level and to retest the $4,5k level.
From a bearish traders perspective, they’re seeking to again retest the long term trendline at $2k and break the bottom of that zone of inflection below the $1,700 level.

Ether’s Moving Averages: 20-Day [$3,130.24], 50-Day [$3,737.11], 100-Day [$3,766.69], 200-Day [$3,254.76], Year to Date [$3,100.88].
ETH’s 24 hour price range is $2,418-$2,717 and its 7 day price range is $2,204-$3,257. Ether’s 52 week price range is $1,238-$4,878.
The price of ETH on this date in 2021 was $1,253.
The average price of ETH for the last 30 days is $3,221.
Ether’s price [+0.12%] closed its daily candle on Wednesday worth $2,461.3 and in green digits for a second consecutive day.
Litecoin Analysis
The price of Litecoin trended lower on Wednesday and LTC closed its daly candle -$.9.
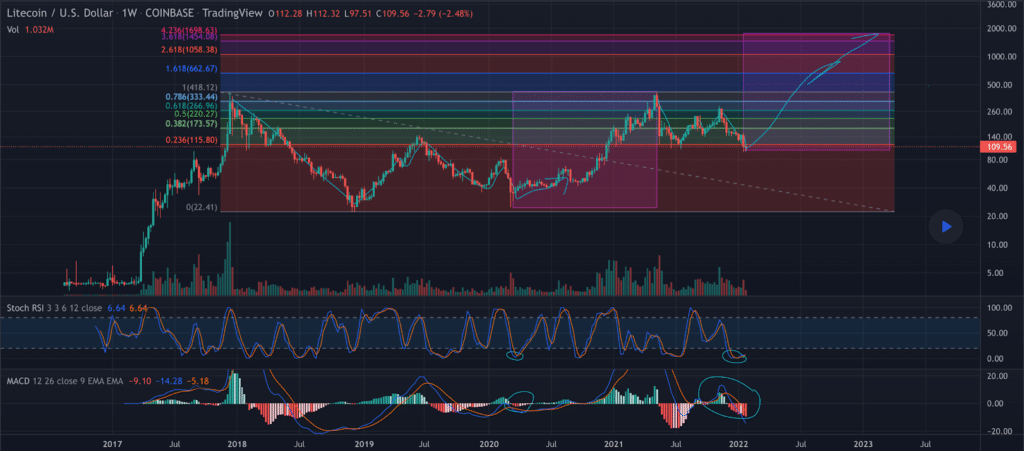
The LTC/USD 1W chart below from DailyTendiess shows Litecoin’s price attempting to cling to the 0.236 fib level [$115.80]. On the weekly time frame bulls are attempting a retest of the 0.382 fib level [$173.57] with a secondary target at 0.5 [$220.27].
Bearish LTC market participants on the other hand are seeking to snap the 0.236 which would signal much greater downside forthcoming potentially for LTC. The next level of support for LTC bulls is a full retrace at the 0 fib level [$22.41]. If the $22.41 level is reached that’s another 80.65% decrease for LTC’s price.

Litecoin’s Moving Averages: 20-Day [$131.48], 50-Day [$157.06], 100-Day [$173.75], 200-Day [$179.14], Year to Date [$130.71].
Litecoin’s 24 hour price range is $105.11-$116.81 and its 7 day price range is $99.66-$142.48. LTC’s 52 week price range is $96.6-$142.48.
Litecoin price on this date last year was $122.81.
The average price for LTC over the last 30 days is $134.44.
Litecoin’s price [-0.83%] closed its daily session on Wednesday worth $107 and in red digits for the third consecutive day.


