Summary
Bitcoin Analysis on Monday
Bitcoin’s price closed its day candle in green figures for the fourth time in five days and finished its daily session on Monday +$587.
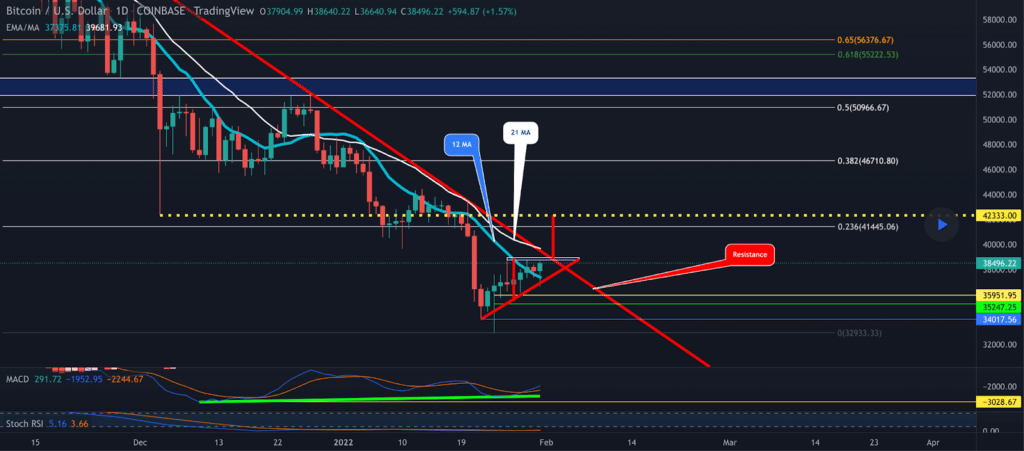
The first chart we analyze today is the BTC/USD 1D chart below from RSibayan. BTC’s price rallied above $38,5k on Monday and bullish BTC traders are now hoping to really test the nearest overhead resistance at $40k. If bullish traders are able to actually penetrate the $40k level to the upside, they’ll shift their focus to their secondary target at the 0.236 fib level [$41,445.06].
Bears conversely are trying to defend the 0.236 fib and send BTC’s price back down to test the bottom of the current range at 0 [$32,933.33]. If bearish BTC traders succeed at breaking that level, the next major support for bullish traders isn’t until the $29k level which is where BTC’s price pivoted after making its initial top just below $65k in 2021.

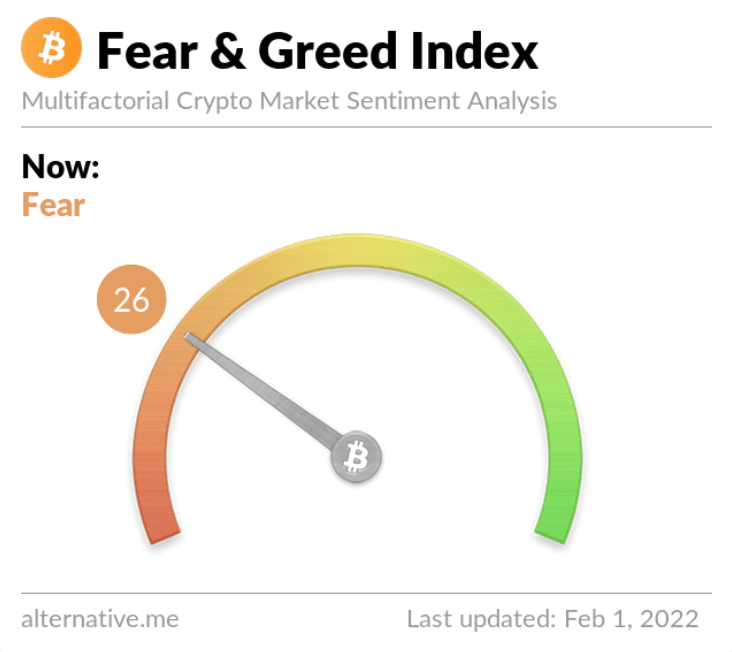
The Fear and Greed Index is 26 Fear and +6 from yesterday’s reading of 20 Extreme Fear.

Bitcoin’s Moving Averages: 20-Day [$40,378.3], 50-Day [$46,519.12], 100-Day [$51,264.66], 200-Day [$46,405.63], Year to Date [$40,902.6].
BTC’s 24 hour price range is $36,831-$38,715 and its 7 day price range is $35,622-$38,715. Bitcoin’s 52 week price range is $29,341-$69,044.
The price of bitcoin on this date last year was $33,405.
The average price of BTC for the last 30 days is $41,025.
Bitcoin’s price [+1.55%] closed its daily candle on Monday worth $38,526 but painted a bearish engulfing candle on the monthly timescale.
Ethereum Analysis
Ether’s price also increased in price on Monday for the fourth consecutive day and finished +$84.06.
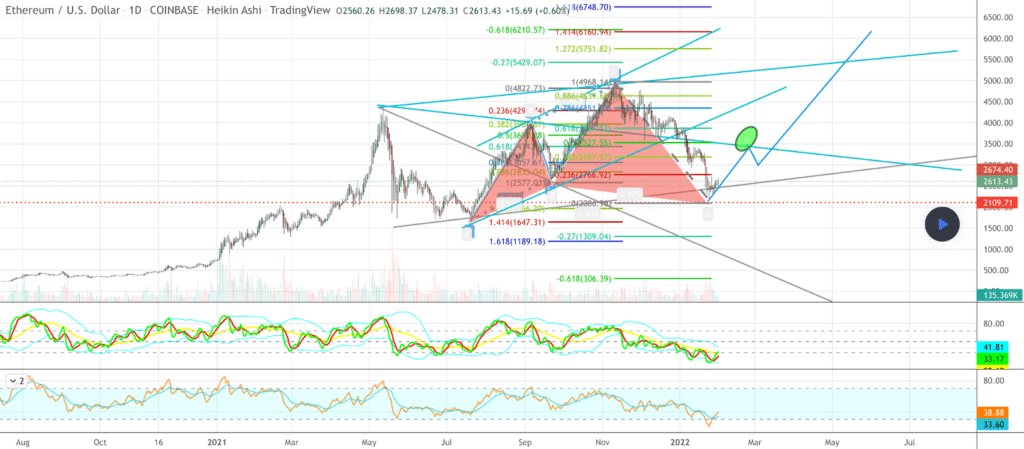
The second chart we’re examining today is the ETH/USD 1D chart from TommyMullings. Ether’s price is currently trading between 0 [$2,086.98] and 0.236 [$2,766.92]. If bullish Ether traders can crack the 0.236 fib level they’ve a secondary target of 0.382 [$3,187.57] and a third target of 0.5 [$3,527.55].
From the perspective of bearish Ether traders, they’re hoping to hold off bullish traders at the 0.236 and again send ETH’s price back down to retest a full retrace at 0 [$2,086.98]. If bears succeed in cracking the 0.236 they’ve a secondary target of 1.414 [$1,647.41] and a third target of 1.618 [$1,189.18].

Ether’s Moving Averages: 20-Day [$2,957.73], 50-Day [$3,638.65], 100-Day [$3,745.45], 200-Day [$3,256.57], Year to Date [$3,032.19].
ETH’s 24 hour price range is $2,499-$2,703 and its 7 day price range is $2,353-$2,703. Ether’s 52 week price range is $1,353-$4,878.
The price of ETH on this date in 2021 was $1,368.
The average price of ETH for the last 30 days is $3,041.
Ether’s price [+3.23%] closed its daily candle on Monday valued at $2,686.66 but also bearishly engulfed for January’s monthly candle close.
Luna Analysis
LUNA’s price climbed with the majority of the cryptocurrency market on Monday and closed its daily candle +$5.71.
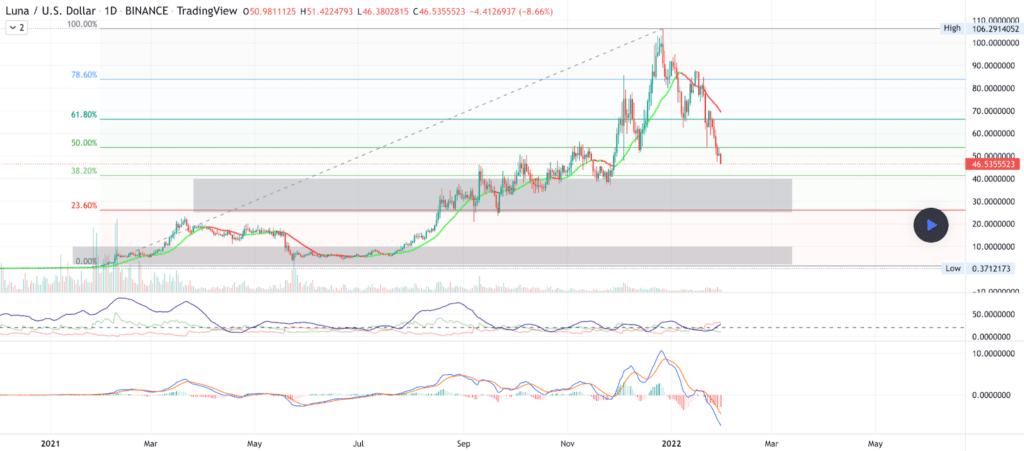
The LUNA/USD 1D chart below from traderramp shows LUNA’s price currently trading between the 38.20% fib level [$41.41] and the 50.00% fib level [$53.77]. If bullish LUNA traders can break the 50.00% fib they’ll then aim at the 61.80% level [$66.43].
Bearish LUNA traders are looking to reject bulls before or at the 50.00% level and send LUNA’s price back down to test the 38.20% fib with a secondary target at the bottom of that level of inflection at the 23.60% fib [$26.28].

LUNA’s Moving Averages: 20-Day [$69.77], 50-Day [$70.67], 100-Day [$54.51], 200-Day [$33.36], Year to Date [$71.50].
Terra’s 24 hour price range is $43.67-$52.13 and its 7 day price range is $43.67-$66.36. LUNA’s 52 week price range is $1.79-$103.34.
Terra’s price on this date last year was $1.79.
The average price for LUNA over the last 30 days is $71.48.
Terra’s price [+12.31%] has finished in red figures for six of the last eight days but managed a bullish engulfing candle on the daily time frame on Monday. LUNA’s price finished its daily session worth $52.10.


