Summary
Bitcoin Analysis
Bitcoin’s price closed its last candle of the week in red figures for a second straight day and finished -$1,391.
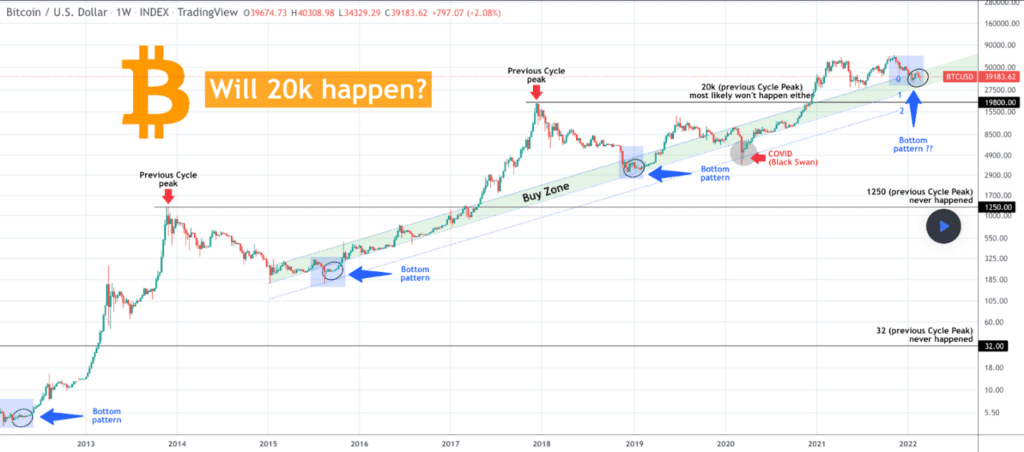
The BTC/USD 1W chart below from TradingShot shows the previous bottom patterns and the buy zones over the history of BTC’s price since 2013. The chartist asks whether or not the June 2021 low was the bottom of BTC’s bear market or whether the $29k level will be tested again. Of course, if BTC’s price breaks down at the $29k level the probability of testing the $20k level or more specifically $19,800 level increases dramatically.

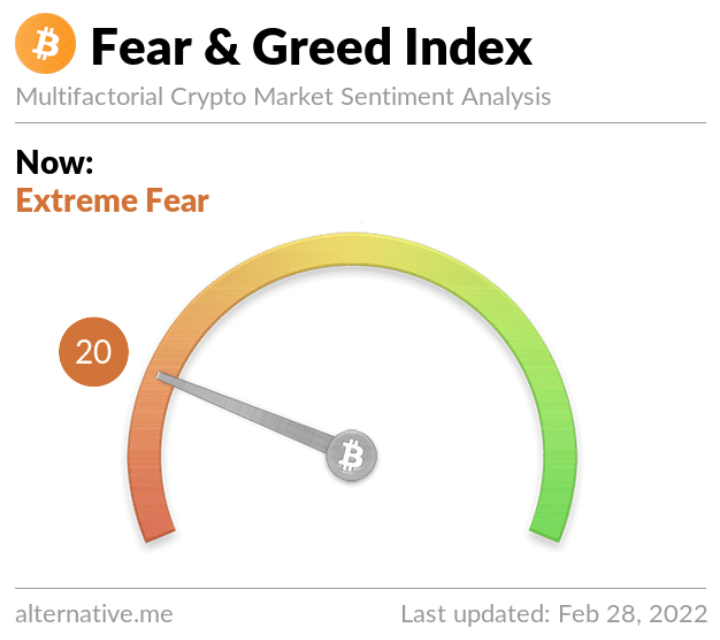
The Fear and Greed Index is 20 Extreme Fear and -6 from Sunday’s reading of 26 Fear.

Bitcoin’s Moving Averages: 20-Day [$40,589.37], 50-Day [$42,421.80], 100-Day [$50,231.21], 200-Day [$45,514.37], Year to Date [$40,870.36].
BTC’s 24 hour price range is $37,421-$39,851 and its 7 day price range is $34,740-$39,851. Bitcoin’s 52 week price range is $29,341-$69,044.
The price of bitcoin on this date last year was $44,970.
The average price of BTC for the last 30 days is $40,242.
Bitcoin’s price [-3.56%] closed its daily candle worth $37,374 on Sunday.
Ethereum Analysis
Ether’s price sold-off more than 5% on Sunday and finished -$160.22 for its last daily candle of the week.
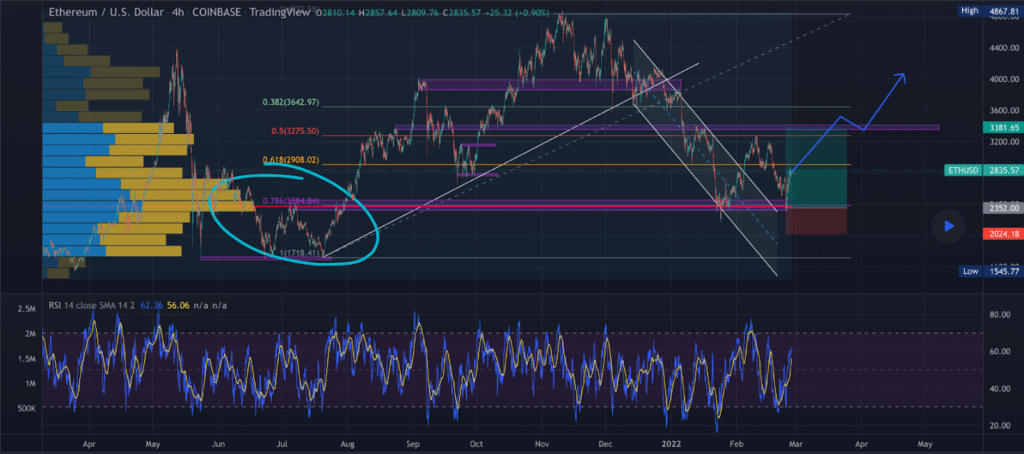
The ETH/USD 4HR chart below from nichtserai shows the potential that ETH’s price double-bottomed at the 0.786 fibonacci level [$2,384.84]. Bullish Ether traders are trying to rally now back above 0.618 [$2,908.02] with a secondary target of 0.5 [$3,275.50].
Bearish Ether market participants are hoping to push ETH’s price below 0.786 and test 1 [$1,718.41] which is a major inflection zone on multiple timescales.

Ether’s Moving Average: 20-Day [$2,864.17], 50-Day [$3,155.58], 100-Day [$3,685.83], 200-Day [$3,218.27], Year to Date [$2,965.65].
ETH’s 24 hour price range is $2,596-$2,937 and its 7 day price range is $2,336-$2,937. Ether’s 52 week price range is $1,353-$4,878.
The price of ETH on this date in 2021 was $1,416.
The average price of ETH for the last 30 days is $2,818.
Ether’s price [-5.77%] closed its daily candle on Sunday worth $2,616.15 and snapped a streak of three straight daily closes in green figures.
Fantom Analysis
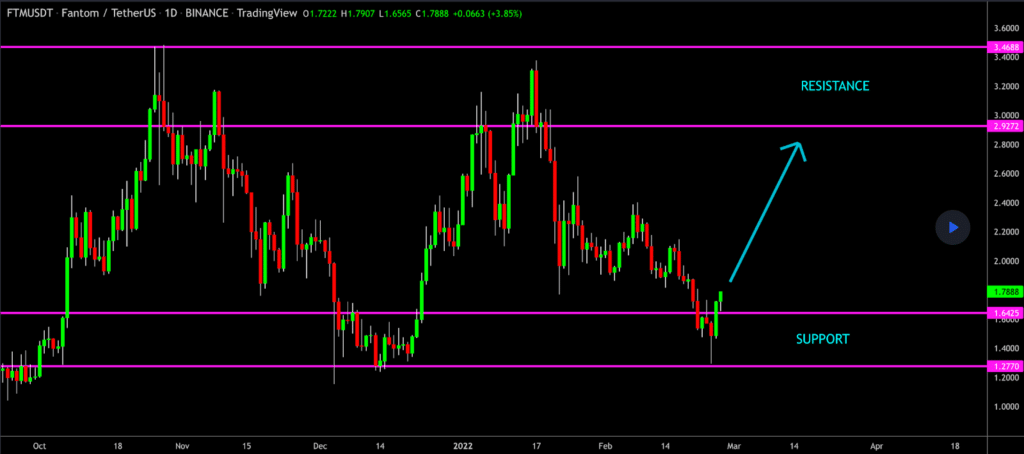
The third chart we’re analyzing today is the FTM/USDT 1D chart from FieryTrading. Fantom’s price found support between the $1.27-$1.64 level. FTM’s price rallied back above support but fell back inside the support zone during Sunday’s daily session.
Bullish FTM traders are aiming to again break the $1.64 level and retest the secondary overhead resistance at $2.92 with a third target of $3.46.
Bearish Fantom traders are looking for a different result and to snap the $1.27 level to the downside which would potentially result in a much larger mark-down on FTM’s price in the future.

Fantom’s 24 hour price range is $1.59-$1.81 and its 7 day price range is $1.34-$1.81. FTM’s 52 week price range is $0.153-$3.46.
Fantom’s price on this date last year was $0.418.
The average price of FTM over the last 30 days is $1.94.
Fantom’s price [-10.45%] closed its daily session on Sunday worth $1.58.


