


Summary
Bitcoin Analysis
Bitcoin’s price finally snapped a streak of eight straight consecutive closes in green figures on Wednesday and concluded its daily session -$389.
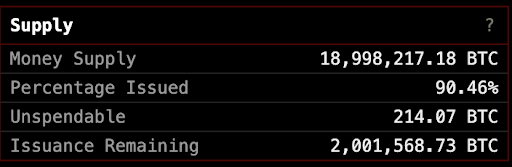
The bitcoin network is just hours away now from the 19 millionth bitcoin being mined. The bitcoin network went live January 3rd, 2009 [4,835 days ago]. The Clark Moody Dashboard lists various data that traders might find useful regarding the BTC network.
The first chart we’re analyzing today is the BTC/USD 1D chart below from gorkemaydogan. It shows BTC’s price trading between the 0.382 fib level [$46,655.78] and 0.5 [$50,883.97], at the time of writing.
The primary target for bullish BTC market participants overhead is 0.5 followed by 0.618 [$55,112.16] and 0.786 [$61,131.94].
Bearish traders are conversely looking to push BTC’s price back below the 0.382 fib level with a secondary target of 0.236 [$41,424.30]. The third target to the downside for bearish traders is a full retracement at 0 [$32,967.93].
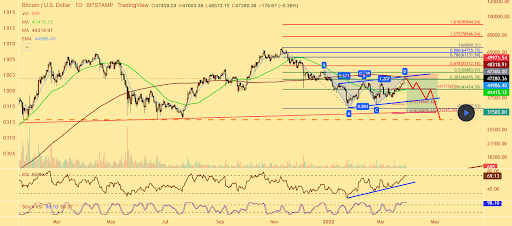
Bitcoin’s Moving Averages: 5-Day [$46,215.74], 20-Day [$41,841.27], 50-Day [$40,805.53], 100-Day [$45,705.52], 200-Day [$46,128.95], Year to Date [$41,291.98].
BTC’s 24 hour price range is $46,750-$47,651 and its 7 day price range is $42,523-$47,884. Bitcoin’s 52 week price range is $29,341-$69,044.
The price of bitcoin on this date last year was $58,817.
The average price of BTC for the last 30 days is $41,753.
Bitcoin’s price [-0.82%] closed its daily candle worth $47,035 on Wednesday.
Ethereum Analysis
Ether’s price also finished in red figures by less than 1% during its daily session on Wednesday and concluded the day -$16.38.
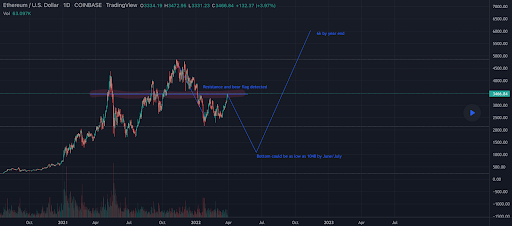
The second chart we’re analyzing today is the ETH/USD 1D chart below by bigfootInvestments. The chartist posits that ETH’s price is setting up for the next leg down and that this could happen soon as the result of overhead resistance at the $3,466 level coupled with a bear flag on the daily timescale.
The target overhead for bullish traders that the author of the chart points out is $6k. The downside target for bearish traders is $1,048 by as early as June or July of this year.
Ether’s Moving Averages: 5-Day [$3,284.15], 20-Day [$2,866.94], 50-Day [$2,824.71], 100-Day [$3,391.61], 200-Day [$3,263.95], Year to Date [$2,931.98].
ETH’s 24 hour price range is $3,346-$3,438 and its 7 day price range is $3,008-$3,464. Ether’s 52 week price range is $1,719-$4,878.
The price of ETH on this date in 2021 was $1,915.83.
The average price of ETH for the last 30 days is $2,857.87.
Ether’s price [-0.48%] closed its daily candle on Wednesday worth $3,385.69.
Fantom Analysis
Fantom’s price finished its daily session also in red digits on Wednesday and wrapped up its daily candle -$0.0077.
The third chart we’re looking at today is the FTM/USD 4HR chart below from Senturko.
Fantom bulls need to reclaim the 0.382 fib level [$1.4342]. Overhead bullish traders are seeking to challenge 0.618 [$1.6788] after 0.382 followed by 0.786 [$1.8529] and 1 [$2.0747] over the interim.
The bearish perspective looks to be an attempt to push FTM’s price again below the 0.382 and $1.40 level followed by targets of 0.236 [$1.3356] and 0 [$1.0383.
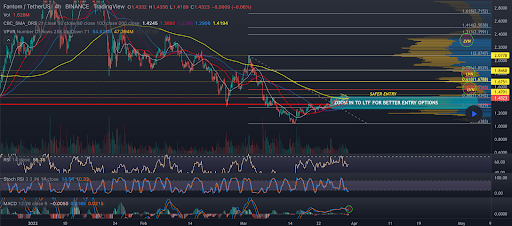
Fantom’s 24 hour price range is $1.38-$1.45 and its 7 day price range is $1.30-$1.48. FTM’s 52 week price range is $0.1532-$3.46.
Fantom’s price on this date last year was $0.42.
The average price of FTM over the last 30 days is $1.36.
Fantom’s price [-0.54%] closed its daily session in red figures and was worth $1.40 when traders settled up on Wednesday. Despite closing Wednesday in red figures FTM’s price has still finished in green digits for eight of the last ten days.

