Summary
Bitcoin Analysis
Bitcoin’s price again was volatile on Tuesday and bullish traders failed to control the territory above the $40k level.
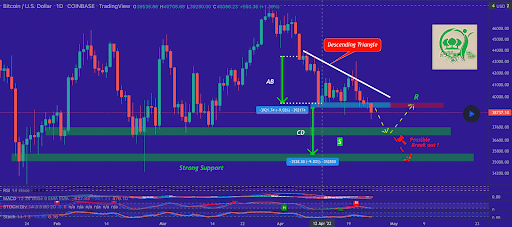
The BTC/USD 1D chart below from TheTreeTrader shows BTC’s price trading within a descending triangle and trying to hold the $38k level.
Bullish traders have support at the $38,747 level and $36,959 level on the chart below. Bullish traders were able to close above the $40k level again on Monday but failed to hold that level during Tuesday’s daily session.

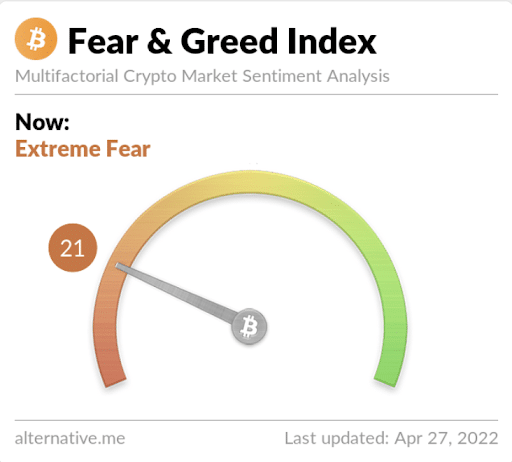
The Fear and Greed Index is 21 Extreme Fear and is -6 from yesterday’s reading of 27 Fear.

Bitcoin’s Moving Averages: 5-Day [$40,434.67], 20-Day [$42,334.66], 50-Day [$41,616.39], 100-Day [$42,731.75], 200-Day [$46,976.28], Year to Date [$41,474.80].
BTC’s 24 hour price range is $37,963-$40,668 and its 7 day price range is $37,963-$42,736. Bitcoin’s 52 week price range is $29,341–$69,044.
The price of Bitcoin on this date last year was $53,978.
The average price of BTC for the last 30 days is $42,755.
Bitcoin’s price [-5.73%] closed its daily candle worth $38,139 and in red figures for the first time in three days.
Ethereum Analysis
Ether’s price also traded in red figures on Tuesday and concluded its daily session -$195.53.
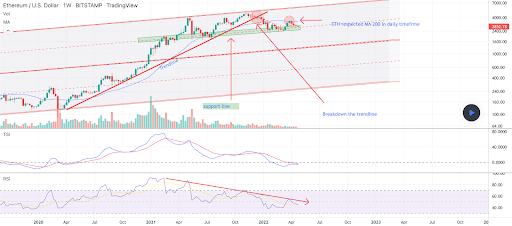
The ETH/USD 1W chart below by MJShahsavar shows Ether’s price clinging to the MA 200 on the daily time frame but the breakdown has already occurred on the weekly timescale.
Bullish Ether traders don’t have support on the weekly timescale until the $1,285 price level if they’re unable to regain that long-term trendline.
Bearish Ether market participants are clearly in control of the weekly time frame, if they’re able to test the $1,285 level the next support level is $586.74.

Ether’s Moving Averages: 5-Day [$3,010.16], 20-Day [$3,155.71], 50-Day [$2,956.06], 100-Day [$3,158.22], 200-Day [$3,366.64], Year to Date [$2,981.16].
ETH’s 24 hour price range is $2,791-$3,025 and its 7 day price range is $2,791-$3,167. Ether’s 52 week price range is $1,719-$4,878.
The price of ETH on this date in 2021 was $2,532.
The average price of ETH for the last 30 days is $3,172.25.
Ether’s price [-6.50%] closed its daily candle on Tuesday worth $2,810.34 and in red figures for the sixth time in seven days.
Dogecoin Analysis
Dogecoin’s price has clearly been impacted by Elon Musk, the world’s publicly richest man over the last two years.
It’s well known that Musk is Dogecoin’s most adamant or widely known supporter and market participants are wondering now what his acquisition of twitter this week means for DOGE’s price.
Dogecoin is the people’s crypto
— Elon Musk (@elonmusk) February 4, 2021
A lot of the hype around DOGE had wound down late in 2021 when Musk again tweeted about DOGE and that Tesla would accept it for certain purchases.
Tesla will make some merch buyable with Doge & see how it goes
— Elon Musk (@elonmusk) December 14, 2021
Are his tweets having an impact on the price of DOGE still and will his recent acquisition of twitter positively impact DOGE’s price or will it have another effect potentially?
On the news that he was potentially buying twitter earlier this week we saw DOGE’s price climb more than 20%.
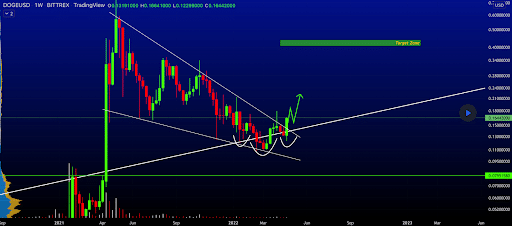
The third chart we’re analyzing for Wednesday is the DOGE/USD 1W chart from Savvythe1. Traders can see DOGE’s price trying to confirm a breakout on the weekly time frame after failing to hold an important long term trendline and rallying.

Dogecoin’s price is -42.68% against The U.S. Dollar for the last 12 months, -23.6% against BTC, and -51.85% against ETH over the same duration, at the time of writing.
Dogecoin’s Moving Averages: 5-Day [$0.145], 20-Day [$0.143], 50-Day [$0.133], 100-Day [$0.147], 200-Day [$0.195], Year to Date [$0.141].
Dogecoin’s 24 hour price range is $0.137-$0.165 and its 7 day price range is $0.124-$0.165. Doge’s 52 week price range is $0.107-$0.731.
Doge’s price on this date last year was $0.271.
The average price of DOGE over the last 30 days is $0.143.
Dogecoin’s price [-12.74%] closed its daily session valued at $0.137 on Tuesday and back in red figures after finishing nearly +20% during Monday’s daily session.


