Summary
Bitcoin Analysis
As the obvious realization that the crypto sector is in the midst of a bear market sets in for the majority of market participants, the sector is left wondering how long will it last and how low will bitcoin go?
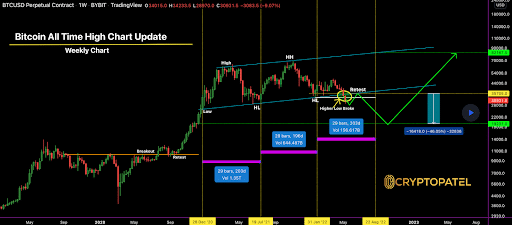
The first chart we’re looking at today is the BTC/USD 1W chart below from CryptoPatel. BTC’s price couldn’t hold the $30k level on Wednesday as bulls capitulated.
The last level of support below $30k was the $29,341 level which was the prior 12 month low and the price that BTC bounced at after the initial drop from the $65k top earlier in 2021. That was the 12 month low until Wednesday when bearish traders scored a new 12 month low on BTC of $27,900.
Traders can see below that the next real support level on the weekly time frame is now $19,231.

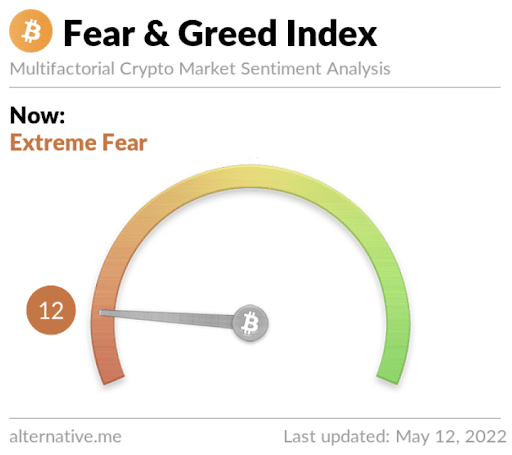
The Fear and Greed Index is 12 Extreme Fear and is equal to Wednesday’s reading of 12 Extreme Fear.

Bitcoin’s Moving Averages: 5-Day [$33,001.88], 20-Day [$38,027.82], 50-Day [$40,653.24], 100-Day [$41,381.54], 200-Day [$46,909.54], Year to Date [$40,828.29].
BTC’s 24 hour price range is $27,900-$31,970 and its 7 day price range is $27,900-$39,798. Bitcoin’s 52 week price range is $29,341-$69,044.
The price of bitcoin on this date last year was $49,725.
The average price of BTC for the last 30 days is $38,253.3 and BTC’s price is -29.4% over the same duration.
Bitcoin’s price [-6.30%] closed its daily candle worth $29,095 on Wednesday and has closed in red figures for six of the last seven days.
Ethereum Analysis
Ether’s price also sold-off lower on Wednesday and lost more than 11% of its value during its daily session. ETH’s price concluded the day -$263.24.
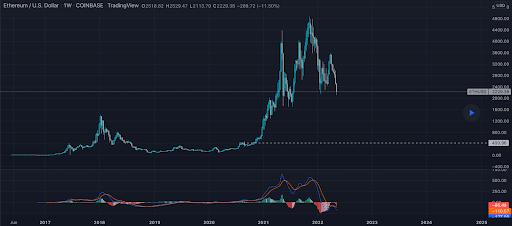
The second chart we’re looking at today is the ETH/USD 1W chart below by largepetrol. Traders will note that ETH’s price has also broken down on the weekly timescale and traditionally alt coins have sold off more than 90% in a bear market.
When applying that 90% drawdown to Ether’s price from its peak of $4,878, we get a potential bottom price around $487.80.
The chartist below’s weekly chart corresponds with this basic rule of 90% or more reduction on alt coins during true bear markets.

Ether’s Moving Averages: 5-Day [$2,457.60], 20-Day [$2,824.53], 50-Day [$2,927.56], 100-Day [$3,009.45], 200-Day [$3,386.45], Year to Date [$2,943.54].
ETH’s 24 hour price range is $2,030-$2,442 and its 7 day price range is $2,030-$2,952. Ether’s 52 week price range is $1,719-$4,878.
The price of ETH on this date in 2021 was $3,821.67.
The average price of ETH for the last 30 days is $2,844.59 and ETH’s -32.69% over the same time frame.
Ether’s price [-11.24%] closed its daily candle on Wednesday worth $2,078.80 and in red figures for the sixth time over the last seven days.
Chainlink Analysis
Chainlink’s price closed 19% lower on Wednesday than when it began the trading day and LINK’s price concluded its daily session -$1.66.
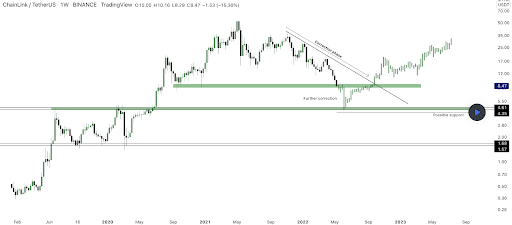
The LINK/USD 1W chart below from OmidBK2003 is the third chart we’re analyzing for Thursday.
We can see on the chart below that LINK’s price arguably led investors into the last bull market and it may potentially be leading the way down also. If history continues, LINK may be one of the first projects to enter an accumulation phase after finding a true market bottom price.
The chartist shows the potential bottom on LINK could be somewhere around the $4 level.

LINK’s Moving Averages: 5-Day [$9.26], 20-Day [$12.01], 50-Day [$13.83], 100-Day [$16.44], 200-Day [$21.47], Year to Date [$16.09].
Chainlink’s 24 hour price range is $6.67-$8.79 and its 7 day price range is $6.67-$12.24. LINK’s 52 week price range is $6.67-$49.67.
Chainlink’s price on this date last year was $40.97.
The average price of LINK over the last 30 days is $12.02 and LINK’s price is -47.23% over the same timespan.
Chainlink’s price [-19.35%] closed its daily session worth $6.92 on Wednesday and has finished in red figures also six times over the last seven daily candles.


