Summary
Bitcoin Analysis
Bitcoin’s price closed its daily candle below the $29k level on Wednesday and BTC concluded its daily session -$1,762.
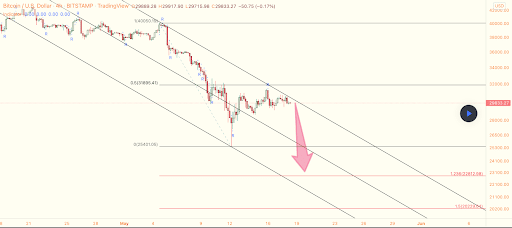
The first chart we’re looking at today is the BTC/USD 4HR chart. That chart below from BobRivera990 shows that BTC’s price has been rejected multiple times at 0.5 [$31,895.41] and that overhead resistance seems to be implying further downside before any significant upside.
The targets overhead for bullish BTC traders are 0.5, and 1 [$40,050.19].
Conversely, the targets to the downside of the 4HR chart for bearish BTC traders are 0 [$25,401.05], 1.236 [$22,812.98] and 1.5 [$20,229.04].


Bitcoin’s Moving Averages: 5-Day [$29,579.45], 20-Day [$35,135.08], 50-Day [$39,576.08], 100-Day [$40,365.14], 200-Day [$46,533.61], Year to Date [$40,233.56].
BTC’s 24 hour price range is $28,766-$30,635 and its 7 day price range is $26,910-$31,319. Bitcoin’s 52 week price range is $26,600-$69,044.
The price of Bitcoin on this date last year was $36,755.
The average price of BTC for the last 30 days is $35,913.9 and BTC’s -25.7% over the same duration.
Bitcoin’s price [-5.79%] closed its daily candle worth $28,680 and in red figures for the second time over the last three days.
Ethereum Analysis
Ether’s price also tumbled lower on Wednesday and ETH concluded its daily candle -$179.30.
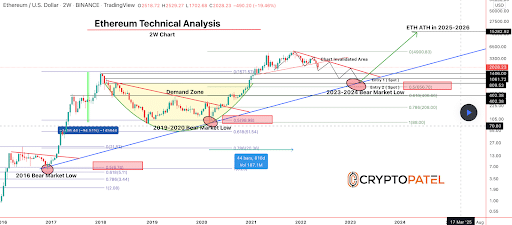
The ETH/USD 2W chart below by CryptoPatel shows the potential for the 0.5 fib level being near the level that ETH’s price finds a new low.
Ether’s price is trading between 0.5 and 0 [$4,900.83], at the time of writing.
The targets for bearish traders to the downside are 0.5 and 0.618 [$400.66].

Ether’s Moving Averages: 5-Day [$2,009.26], 20-Day [$2,556.32], 50-Day [$2,861.57], 100-Day [$2,910.40], 200-Day [$3,359.89], Year to Date [$2,894.04].
ETH’s 24 hour price range is $1,911-$2,104 and its 7 day price range is $1,824-$2,156. Ether’s 52 week price range is $1,719-$4,878.
The price of ETH on this date in 2021 was $2,435.65.
The average price of ETH for the last 30 days is $2,617.43 and ETH’s -33.47% over the same time frame.
Ether’s price [-8.57%] closed its daily candle on Wednesday worth $1,911.83.
Cardano Analysis
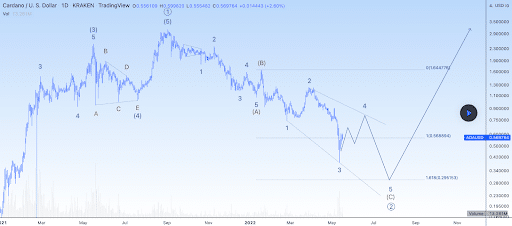
Cardano was the worst performer of today’s trio and sold-off by more than 12% during Wednesday’s daily session. ADA’s price finished Wednesday’s session -$0.073.
The third chart we’re analyzing today is the ADA/USD 1D chart below from NapoleonEWT. ADA’s price is trading between 0.618 [$0.295] and 1 [$0.568], at the time of writing.
If bearish ADA traders can continue to push ADA’s price lower, the primary target inside the descending broadening wedge is the 1.618 fib level [$0.295].

Cardano’s 24 hour price range is $0.505-$0.583 and its 7 day price range is $0.408-$0.60. ADA’s 52 week price range is $0.40-$3.09.
Cardano’s price on this date last year was $1.47.
The average price of ADA over the last 30 days is $0.75 and ADA’s -41.31% over the same timespan.
Cardano’s price [-12.62%] closed its daily candle valued at $0.504 on Wednesday.


