Summary
Bitcoin Analysis
Bitcoin’s price closed back in green figures by less than 1% on Tuesday and finished +$138.8 for its daily session.
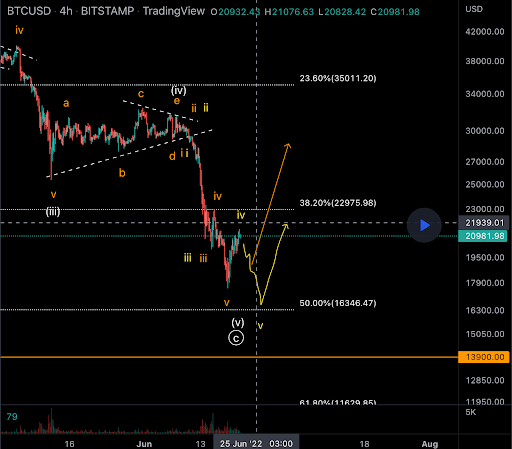
The first chart of emphasis today is the BTC/USD 4HR chart below from TornadoCapital. BTC’s price is trading between 50.00% [$16,346.47] and 38.20% [$22,975.98], at the time of writing.
The territory that bulls need to reclaim overhead firstly is that above the 38.20% fib level. Bullish BTC market participants have a second target of 23.60% [$35,011.20].
Bearish traders conversely want to send BTC’s price back below the $20k level and retest multi-year lows at the 50.00% fib level. If BTC bears can push BTC’s price below the 50.00% fib level their next target to the downside is 61.80% [$11,629.85].

Bitcoin’s Moving Averages: 5-Day [$20,799.91], 20-Day [$27,101.00], 50-Day [$32,147.88], 100-Day [$37,023.84], 200-Day [$44,146.10], Year to Date [$37,726.32].
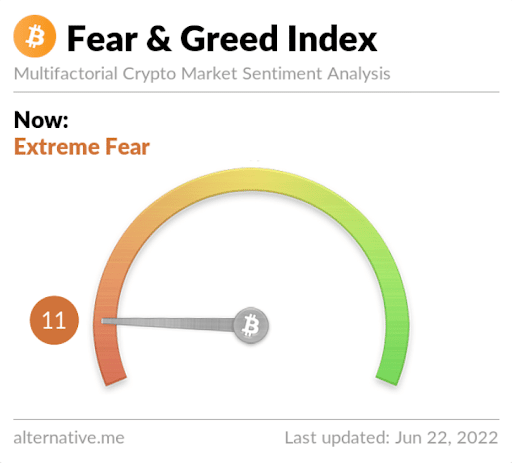
The Fear and Greed Index is 11 Extreme Fear and is +2 from Tuesday’s reading of 9 Extreme Fear.

BTC’s 24 hour price range is $20,327-$21,675 and its 7 day price range is $17,760-$22,664. Bitcoin’s 52 week price range is $17,611-$69,044.
The price of bitcoin on this date last year was $32,553.
The average price of BTC for the last 30 days is $27,324.1 and its -26.4% over the same time frame.
Bitcoin’s price [+0.68%] closed its daily candle worth $20,692.9 and back in green figures on Tuesday.
Ethereum Analysis
Ether’s price finished marginally down on Tuesday and when traders settled up at the conclusion of Tuesday’s daily session ETH was -$2.23.
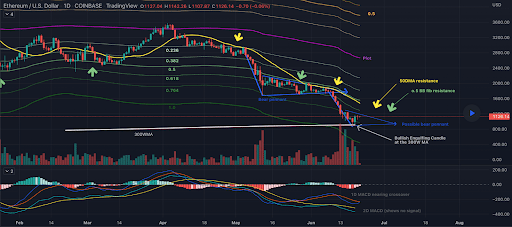
Tuesday’s second chart of emphasis is the ETH/USD 1D chart below by MiserableToppings. Ether’s price engulfed bullishly at the 300W MA and moved quickly back above the $1k level following that bounce.
The chartist denotes that ETH’s price could be forming a possible bearish pennant which would send ETH’s price potentially back down to test multi-year lows and the $400-$500 level.
Bullish traders have overhead resistance at the 0.1 fib level [$1,451.37].

Ether’s Moving Averages: 5-Day [$1,123.19], 20-Day [$1,591.18], 50-Day [$2,184.01], 100-Day [$2,565.31], 200-Day [$3,155.94], Year to Date [$2,650.43].
ETH’s 24 hour price range is $1,105.87-$1,194 and its 7 day price range is $897.49-$1,235.88. Ether’s 52 week price range is $883.62-$4,864.13.
The price of ETH on this date in 2021 was $1,877.48.
The average price of ETH for the last 30 days is $1,629.15 and its -40.26% over the same duration.
Ether’s price [-0.20%] closed its daily candle on Tuesday worth $1,126.06 and in red figures for a second consecutive day.
Avalanche Analysis
Avalanche’s price lost less than 1% of its value on Tuesday and AVAX concluded its daily candle -$0.17.
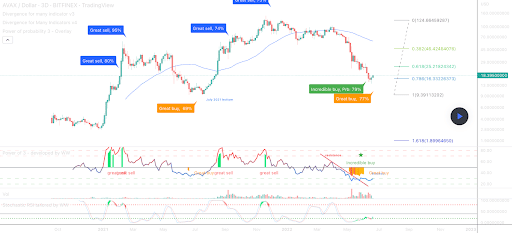
The third chart we’re looking at today is the AVAX/USD 3D chart below from without_worries. AVAX’s price is trading between the 0.786 fib level [$16.32] and 0.618 [$24.21], at the time of writing.
Bullish AVAX traders have overhead targets of 0.618, 0.382 [$46.42], and a full retracement back to 0 [$124.66].
From the perspective of bearish traders, they’re targeting 0.786 [$16.32]. If bears overcome the 0.786 fib level their next target is 1.618 [$1.89].

Avalanche’s Moving Averages: 5-Day [$16.96], 20-Day [$21.92], 50-Day [$41.88], 100-Day [N/A], 200-Day [N/A], Year to Date [$52.16].
Avalanche’s 24 hour price range is $16.62-$18.49 and its 7 day price range is $13.87-$18.49. AVAX’s 52 week price range is $9.33-$146.29.
Avalanche’s price on this date last year was $11.22.
The average price of AVAX over the last 30 days is $22.67 and its -37.73% for the same timespan.
Avalanche’s price [-0.99%] closed its daily session on Tuesday worth $16.92 and snapped two straight days of buyer’s controlling the market.


