Summary
Bitcoin Analysis
Bitcoin’s price rallied higher in unison with a bullish engulfing candle from the aggregate crypto market cap on Monday and BTC’s price concluded its daily session +$1,695.
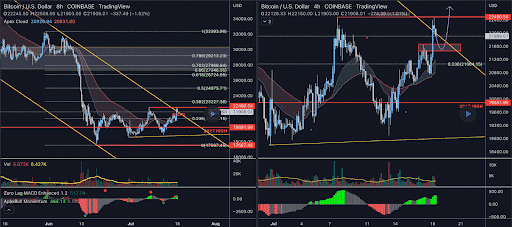
Today we’re analyzing separate BTC charts from the same chartist. The first chart is the BTC/USD 8HR chart from ApexBull. Traders will note that BTC’s price is trading between 0.236 [$21,064.15] and 0.382 [$23,227.36], at the time of writing.
The next three targets above for bullish BTC traders on the 8HR timescale are 0.382, 0.5 [$24,975.71], and 0.618 [$26,724.05].
Bearish traders participating in shorting the bitcoin market are eyeing the 0.236 fibonacci level first, followed by a secondary target of a full retracement at 0 [$17,567.45].

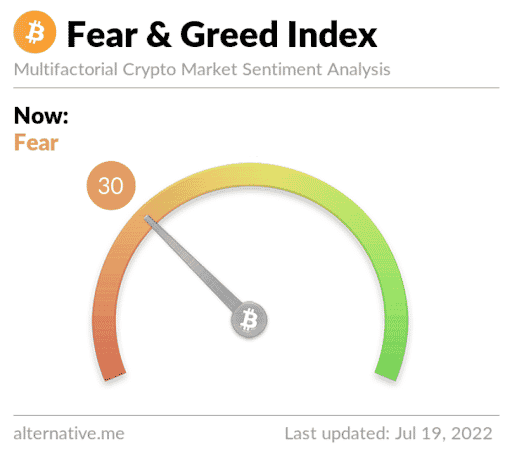
The Fear and Greed Index is 30 Fear and is +10 from Monday’s reading of 20 Extreme Fear.

Bitcoin’s Moving Averages: 5-Day [$20,564.09], 20-Day [$20,477.78], 50-Day [$25,120.68], 100-Day [$33,151.34], 200-Day [$41,612.90], Year to Date [$35,401.43].
BTC’s 24 hour price range is $20,785-$22,958 and its 7 day price range is $19,113-22,958. Bitcoin’s 52 week price range is $17,611-$69,044.
The price of Bitcoin on this date last year was $30,847.
The average price of BTC for the last 30 days is $20,520.2 and its +8.7% over the same duration.
Bitcoin’s price [+8.16%] closed its daily candle on Monday worth $22,476 and in green digits for the fifth time over the last six days.
Ethereum Analysis
Ether’s price is +71% from its 2022 low, at the time of writing and ETH closed Monday’s daily session +$246.93.
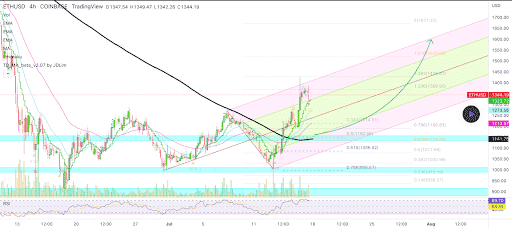
The second chart we’re analyzing today is the ETH/USD 4HR chart below by AlanSantana. ETH’s price is trading between the 1.236 fibonacci level [$1,368.90] and 1.382 [$1,426.67], at the time of writing.
The primary target for Ether bulls is 1.382, followed by targets above that level of 1.618 [$1,520.06], and 2 [$1,671.22].
Conversely, bearish Ether traders shorting that market are looking to push ETH’s price below 1.236 with a secondary target of 0.786 [$1,190.83]. The third target of bearish traders participating in the Ether market is 0.618 [$1,124.35].

ETH’s 24 hour price range is $1,342.6-$1,631 and its 7 day price range is $1,027.42-$1,631. Ether’s 52 week price range is $883.62-$4,878.
The price of ETH on this date in 2021 was $1,818.36.
The average price of ETH for the last 30 days is $1,164.58 and its +36.53% over the same time frame.
Ether’s price [+18.46%] closed its daily candle worth $1,584.77 on Monday and ETH’s also closed in green figures for five of the last six daily candles.
Solana Analysis
Solana’s price also traded higher on Monday and posted a daily session of +$4.93.
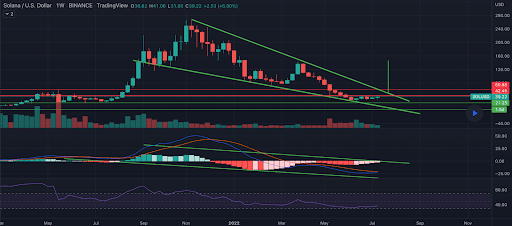
The last chart we’re looking at for Tuesday is the SOL/USD 1W chart below from thenetsterr.
Bullish Solana market participants are attempting to break out of a falling wedge this week on the weekly time frame. The levels they need to regain are $42.45 and $60.88 to clear the nearest overhead hurdles.
If bullish traders can reclaim the $60.88 level then there’s a great opportunity for them to send SOL higher over the coming weeks.

Solana’s Moving Averages: 5-Day [$36.70], 20-Day [$36.30], 50-Day [$40.56], 100-Day [$69.63], 200-Day [$116.57], Year to Date [$82.84].
Solana’s 24 hour price range is $38.76-$44.93 and its 7 day price range is $32.26-$44.93. Solana’s 52 week price range is $22.23-$259.96.
SOL’s price on this date last year was $26.72.
The average price of SOL over the last 30 days is $36.46 and its +37.43% over the same timespan.
Solana’s price [+12.77%] closed its daily candle on Monday worth $43.54 and like BTC and ETH, SOL’s finished five of the last six days in positive figures.


