Summary
Bitcoin Analysis
Bitcoin’s price rallied during Monday’s final hourly candle and buyers pulled another power hour move to close the daily session just marginally in negative figures [-$35].
The first chart we’re looking at for this Tuesday is the BTC/USD 4HR chart below from howard2535. BTC’s price is trading between the 0.5 fibonacci level [$22,695.85] and 0.382 [$23,163.56], at the time of writing.
The overhead targets on bitcoin for bullish BTC market participants are 0.382, 0 [$24,677.69], and 1 [$25,217.88].
Bearish traders are trying to again crack the 0.5 fib level with a secondary target of 0.618 [$22,228.14]. The third target for BTC bears is 0.786 [$21,562.24].

The Fear and Greed Index is 31 Fear and is -2 from yesterday’s reading of 33 Fear.

Bitcoin’s Moving Averages: 5-Day [$22,959.58], 20-Day [$21,809.27], 50-Day [$23,782.11], 100-Day [$31,392.66], 200-Day [$39,707.52], Year to Date [$34,571.23].
BTC’s 24 hour price range is $22,879-$23,499 and its 7 day price range is $20,783-$24,581. Bitcoin’s 52 week price range is $17,611-$69,044.
The price of bitcoin on this date last year was $39,156.
The average price of BTC for the last 30 days is $21,588.1 and its +17.8% for the same duration.
Bitcoin’s price [-0.15%] closed its daily candle worth $23,259 on Monday and in red figures for a fourth consecutive day.
Ethereum Analysis
Ether’s price sold-off nearly 3% on Monday and when traders settled-up at the daily candle close ETH was -$49.92.
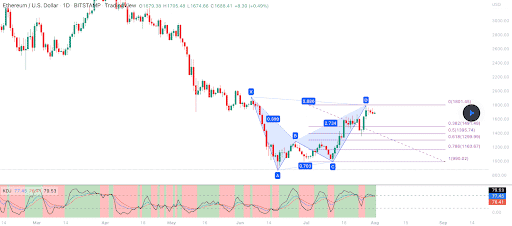
The second chart for analysis this Tuesday is the ETH/USD 1D chart below by XTrendSpeed. Ether’s price was rejected numerous times at the $1,800 level as shown below and has reversed course to the downside. Ether’s price is trading between 0.382 [$1,491.48] and 0 [$1,801.45], at the time of writing.
Bullish Ether traders have a primary overhead target still of 0.382 [$1,801.45]. Those looking for further upside yet need to break that fib level and secure candle close confirmation on the daily time frame to signal to market participants that there may be further upside on the chart forthcoming.
Conversely, bearish Ether traders are looking to push ETH’s price below the 0.382, followed by a secondary target of 0.5 [$1,395.74], and a third target of 0.618 [$1,299.99].

Ether’s Moving Averages: 5-Day [$1,623.58], 20-Day [$1,390.64], 50-Day [$1,433.68], 100-Day [$2,130.04], 200-Day [$2,845.61], Year to Date [$2,392.34].
ETH’s 24 hour price range is $1,606.12-$1,704.68 and its 7 day price range is $1,367.93-$1,759.5. Ether’s 52 week price range is $883.62-$4,878.
The price of ETH on this date in 2021 was $2,606.99.
The average price of ETH for the last 30 days is $1,369.38 and its +57.76% for the same time frame.
Ether’s price [-2.97%] closed its daily candle on Monday worth $1,630.15 and in red figures for the fourth day in a row.
Dogecoin Analysis
Dogecoin’s price wasn’t a casualty of the macro on Monday and buyers pushed the price higher by $0.00035 for its daily trading session.
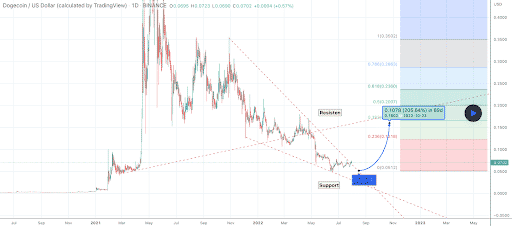
Today’s last chart for analysis is the DOGE/USD 1D chart below from Clarion_Star. DOGE’s price is trading between the 0 fib level [$0.0512] and 0.236 [$0.1218].
The overhead targets for DOGE bulls are 0.236, 0.382 [$0.1653], and 0.5 [$0.2007].
Bearish traders are looking to send DOGE back down to retest a full retracement at the 0 fib level and to inflict further damage if they successfully break that level to the downside.

Dogecoin’s Moving Averages: 5-Day [$0.0669], 20-Day [$0.066], 50-Day [$0.069], 100-Day [$0.097], 200-Day [$0.138], Year to Date [$0.113].
Doge’s 24 hour price range is $0.066-$0.071 and its 7 day price range is $0.060-$0.072. Dogecoin’s 52 week price range is $0.049-$0.351.
Dogecoin’s price on this date last year was $0.203.
The average price of DOGE over the last 30 days is $0.066 and its +4.05% over the same timespan.
Dogecoin’s price [+0.51%] closed its trading session on Monday worth $0.068460 and in green figures for the second time in three days.


