Summary
Bitcoin Analysis
Bitcoin’s price led the macro crypto market lower during Wednesday’s daily session and when traders settled-up at session close, BTC was -$150.3.
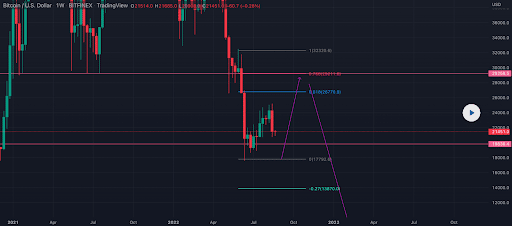
We’re starting Thursday’s price analyses with the king of the industry and the BTC/USD 1W chart below from gran1t. BTC’s price is trading between the 0 fibonacci level [$17,792.0] and 0.618 [$26,770.9], at the time of writing.
Bullish traders were rejected numerous times this month at the $25k level and they’ll need to close above that level on the weekly time frame and then above the 0.618 to signal that bullish traders are still pressing higher. The secondary target of bullish BTC traders is 0.786 [$29,211.0] and their third target is 1 [$32,320.6].
Bitcoin’s RSI is also in the bearish control zone on the 1D time frame and finished Wednesday’s candle under 40.
There’s bearish divergence also appearing on the 2HR and 4HR BTC charts, so, traders will have to wait to see if support at $17,792.00 can hold over the coming weeks if the bearish divergence plays out and BTC’s price suffers continuation to the downside.


Bitcoin’s Moving Averages: 5-Day [$21,746.97], 20-Day [$23,131.46], 50-Day [$21,831.5], 100-Day [$27,823.83], 200-Day [$36,336.8], Year to Date [$33,403.91].
BTC’s 24 hour price range is $21,145-$21,900 and its 7 day price range is $20,945-$23,545. Bitcoin’s 52 week price range is $17,611-$69,044.
The price of Bitcoin on this date last year was $48,995.5.
The average price of BTC for the last 30 days is $22,926.6 and its -5.4% over the same time frame.
Bitcoin’s price [-0.70%] closed its daily candle worth $21,365.3 and back in red figures after a one day reprieve from negative price action on Tuesday.
Ethereum Analysis
Ether’s price also finished down less than 1% during Wednesday’s trading session and ETH’s price concluded the day -$8.76.
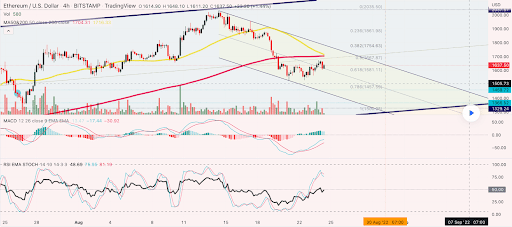
The ETH/USD 4HR chart below by RyodaBrainless is the second chart we’re analyzing today. ETH’s price is trading between 0.5 [$1,667.87] and 0.382 [$1,754.63], at the time of writing.
Those expecting an extended uptrend on ETH still have targets overhead of 0.382, 0.236 [$1,861.98], and 0 [$2,035.50].
Bearish traders that likely believe this cycle’s low price has yet to be made are short the Ether market and attempting to push ETH’s price below 0.5 again. The second target for bears is 0.618 [$1,581.11], followed by 0.786 [$1,457.59], with a fourth target to the downside of 1 [$1,300.25].

ETH’s 24 hour price range is $1,604.92-$1,694.13 and its 7 day price range is $1,556.49-$1,878.09. Ether’s 52 week price range is $883.62-$4,878.
The price of ETH on this date in 2021 was $3,228.4.
The average price of ETH for the last 30 days is $1,709.38 and its +7.77% over the same duration.
Ether’s price [-0.53%] closed its daily candle on Wednesday worth $1,656.64 and in red digits for the first time in four days.
Chainlink Analysis
Chainlink’s price couldn’t escape Wednesday’s blackhole of negative price action and LINK finished its daily candle -$0.12.
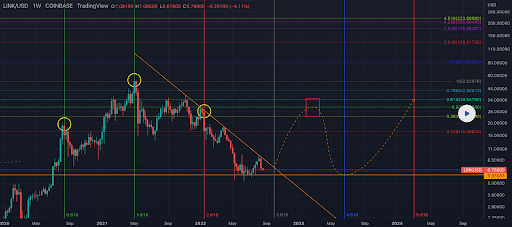
The LINK/USD 1W chart below from Sporia is the last chart we’re looking at this week and possibly the most interesting short-term to dissect. LINK’s price is trading between the 0 fibonacci level and 0.236 [$16.46], at the time of writing.
The overhead targets on the weekly timescale for bulls of the Chainlink market are 0.236, 0.382 [$23.37], 0.5 [$28.96], and 0.618 [$34.54].
Bearish LINK traders are hoping they can push LINK’s price below the $6 level again and make a fresh cycle low below the $5.32 level.

LINK’s price is +10.38% against The U.S. Dollar over the last 12 months, +49.42% against BTC, and +20.06% against ETH, over the same time frame.
Chainlink’s 24 hour price range is $7.02-$7.38 and its 7 day price range is $6.73-$8.21. LINK’s 52 week price range is $5.32-$38.17.
Chainlink’s price on this date last year was $26.62.
The average price of LINK over the last 30 days is $7.74 and its +5.74% over the same timespan.
Chainlink’s price [-1.60%] closed its daily trading session on Wednesday worth $7.12 and in red figures again after finishing Tuesday in positive figures.


